CVS 2012 Annual Report Download - page 26
Download and view the complete annual report
Please find page 26 of the 2012 CVS annual report below. You can navigate through the pages in the report by either clicking on the pages listed below, or by using the keyword search tool below to find specific information within the annual report.-
 1
1 -
2
-
3
-
4
-
5
-
6
-
7
-
8
-
9
-
10
-
11
-
12
-
13
-
14
-
15
-
 16
16 -
 17
17 -
 18
18 -
 19
19 -
 20
20 -
 21
21 -
 22
22 -
 23
23 -
 24
24 -
 25
25 -
 26
26 -
 27
27 -
 28
28 -
 29
29 -
 30
30 -
 31
31 -
 32
32 -
 33
33 -
 34
34 -
 35
35 -
 36
36 -
37
-
38
-
39
-
40
-
41
-
42
-
43
-
44
-
45
-
46
-
47
-
48
-
49
-
50
-
51
-
52
-
53
-
54
-
55
-
56
-
57
-
58
-
59
-
60
-
61
-
62
-
63
-
64
-
65
-
66
-
67
-
68
-
69
-
70
-
71
-
72
-
73
-
74
-
75
-
76
-
77
-
78
-
79
-
80
-
81
-
82
-
83
-
84
-
85
-
86
-
87
-
88
-
89
-
90
-
91
-
92
 |
 |

Management’s Discussion and Analysis of
Financial Condition and Results of Operations
CVS CAREMARK 2012 ANNUAL REPORT
24
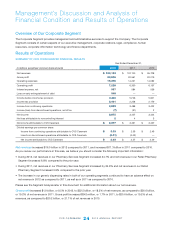
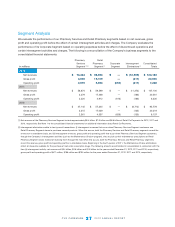
Overview of Our Corporate Segment
The Corporate Segment provides management and administrative services to support the Company. The Corporate
Segment consists of certain aspects of our executive management, corporate relations, legal, compliance, human
resources, corporate information technology and finance departments.
Results of Operations
SUMMARY OF OUR CONSOLIDATED FINANCIAL RESULTS
Year Ended December 31,
In millions, except per common share amounts 2012 2011 2010
Net revenues $ 123,133 $ 107,100 $ 95,778
Gross profit 22,506 20,561 20,219
Operating expenses 15,278 14,231 14,082
Operating profit 7,228 6,330 6,137
Interest expense, net 557 584 536
Loss on early extinguishment of debt 348 — —
Income before income tax provision 6,323 5,746 5,601
Income tax provision 2,441 2,258 2,179
Income from continuing operations 3,882 3,488 3,422
Income (loss) from discontinued operations, net of tax (7) (31) 2
Net income 3,875 3,457 3,424
Net loss attributable to noncontrolling interest 2 4 3
Net income attributable to CVS Caremark $ 3,877 $ 3,461 $ 3,427
Diluted earnings per common share:
Income from continuing operations attributable to CVS Caremark $ 3.03 $ 2.59 $ 2.49
Loss from discontinued operations attributable to CVS Caremark (0.01) (0.02) —
Net income attributable to CVS Caremark $ 3.03 $ 2.57 $ 2.49
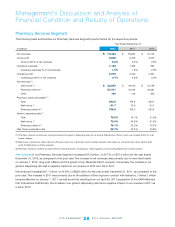
Net revenues
increased $16.0 billion in 2012 compared to 2011, and increased $11.3 billion in 2011 compared to 2010.
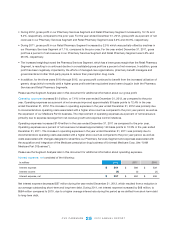
As you review our performance in this area, we believe you should consider the following important information:
• During2012,netrevenuesinourPharmacyServicesSegmentincreased24.7%andnetrevenuesinourRetailPharmacy
Segmentincreased6.8%comparedtotheprioryear.
• During2011,netrevenuesinourPharmacyServicesSegmentincreasedby24.9%andnetrevenuesinourRetail
PharmacySegmentincreased3.9%comparedtotheprioryear.
• Theincreaseinourgenericdispensingratesinbothofouroperatingsegmentscontinuedtohaveanadverseeffecton
net revenue in 2012 as compared to 2011, as well as in 2011 as compared to 2010.
Please see the Segment Analysis later in this document for additional information about our net revenues.
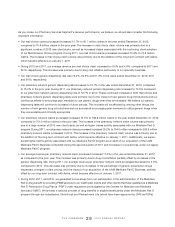
Gross profit
increased$1.9billion,or9.5%in2012,to$22.5billion,or18.3%ofnetrevenues,ascomparedto$20.6billion,
or19.2%ofnetrevenuesin2011.Grossprotincreased$342million,or1.7%in2011,to$20.6billion,or19.2%ofnet
revenues,ascomparedto$20.2billion,or21.1%ofnetrevenuesin2010.