CVS 2012 Annual Report Download - page 76
Download and view the complete annual report
Please find page 76 of the 2012 CVS annual report below. You can navigate through the pages in the report by either clicking on the pages listed below, or by using the keyword search tool below to find specific information within the annual report.-
 1
1 -
2
-
3
-
4
-
5
-
6
-
7
-
8
-
9
-
10
-
11
-
12
-
13
-
14
-
15
-
16
-
17
-
18
-
19
-
20
-
21
-
22
-
23
-
24
-
25
-
26
-
27
-
28
-
29
-
30
-
31
-
32
-
33
-
34
-
35
-
36
-
37
-
38
-
39
-
40
-
41
-
42
-
43
-
44
-
45
-
46
-
47
-
48
-
49
-
50
-
51
-
52
-
53
-
54
-
55
-
56
-
57
-
58
-
59
-
60
-
61
-
62
-
63
-
64
-
65
-
 66
66 -
 67
67 -
 68
68 -
 69
69 -
 70
70 -
 71
71 -
 72
72 -
 73
73 -
 74
74 -
 75
75 -
 76
76 -
 77
77 -
 78
78 -
 79
79 -
 80
80 -
 81
81 -
 82
82 -
 83
83 -
 84
84 -
 85
85 -
 86
86 -
87
-
88
-
89
-
90
-
91
-
92
 |
 |

CVS CAREMARK 2012 ANNUAL REPORT
74
Notes to Consolidated Financial Statements
The Company’s restricted awards are considered non-vested share awards and require no payment from the employee.
Compensation cost is recorded based on the market price on the grant date and is recognized on a straight-line basis
over the requisite service period. The Company granted 1,811,000, 1,121,000 and 1,095,000 restricted stock units with a
weighted average fair value of $44.80, $34.84 and $35.25 in 2012, 2011 and 2010, respectively. As of December 31, 2012,
there was $67 million of total unrecognized compensation cost related to the restricted stock units that are expected to
vest. These costs are expected to be recognized over a weighted-average period of 2.06 years. The total fair value of
restricted shares vested during 2012, 2011 and 2010 was $81 million, $33 million and $44 million, respectively.
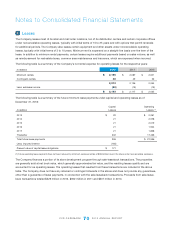
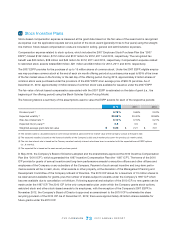
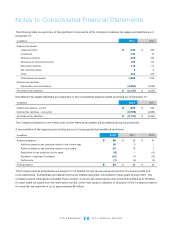
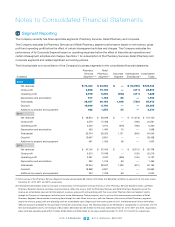
The following table is a summary of the restricted stock unit and restricted share award activity for the year ended
December 31, 2012:
Weighted Average Grant
Units in thousands Units Date Fair Value
Nonvested at beginning of year 2,606 $ 32.80
Granted 1,811 44.80
Vested (1,917) 43.10
Forfeited (150) 37.77
Nonvested at end of year 2,350 $ 33.32
All grants under the 2010 ICP are awarded at fair market value on the date of grant. The fair value of stock options is
estimated using the Black-Scholes Option Pricing Model and stock-based compensation is recognized on a straight-line
basis over the requisite service period. Options granted prior to 2004 generally become exercisable over a four-year period
from the grant date and expire ten years after the date of grant. Options granted between 2004 and 2010 generally become
exercisable over a three-year period from the grant date and expire seven years after the grant date. Beginning in 2011,
options granted generally become exercisable over a four-year period from the grant date and expire seven years after the
grant date.
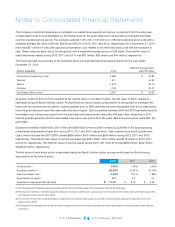
Excess tax benefits of $28 million, $21 million and $28 million were included in financing activities in the accompanying
consolidated statements of cash flow during 2012, 2011 and 2010, respectively. Cash received from stock options exer-
cised, which includes the 2007 ESPP, totaled $836 million, $431 million and $285 million during 2012, 2011 and 2010,
respectively. The total intrinsic value of options exercised was $321 million, $161 million and $118 million in 2012, 2011
and 2010, respectively. The total fair value of options vested during 2012, 2011 and 2010 was $386 million, $452 million
and $445 million, respectively.
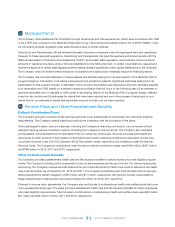
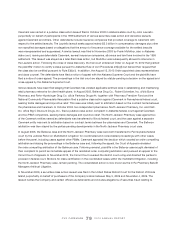
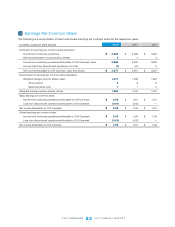
The fair value of each stock option is estimated using the Black-Scholes option pricing model based on the following
assumptions at the time of grant:
2012 2011 2010
Dividend yield (1) 1.44 % 1.43% 1.00%
Expected volatility (2) 32.49 % 32.62% 33.15%
Risk-free interest rate( 3) 0.84 % 1.81% 1.85%
Expected life
(in years)
(4) 4.7 4.7 4.3
Weighted-average grant date fair value $ 11.12 $ 9.19 $ 9.49
(1) The dividend yield is based on annual dividends paid and the fair market value of the Company’s stock at the grant date.
(2) The expected volatility is estimated using the Company’s historical volatility over a period equal to the expected life of each option grant after adjustments
for infrequent events such as stock splits.
(3) The risk-free interest rate is selected based on yields from U.S. Treasury zero-coupon issues with a remaining term equal to the expected term of the
options being valued.
(4) The expected life represents the number of years the options are expected to be outstanding from grant date based on historical option holder exercise
experience.