CVS 2012 Annual Report Download - page 30
Download and view the complete annual report
Please find page 30 of the 2012 CVS annual report below. You can navigate through the pages in the report by either clicking on the pages listed below, or by using the keyword search tool below to find specific information within the annual report.-
 1
1 -
2
-
3
-
4
-
5
-
6
-
7
-
8
-
9
-
10
-
11
-
12
-
13
-
14
-
15
-
16
-
17
-
18
-
19
-
 20
20 -
 21
21 -
 22
22 -
 23
23 -
 24
24 -
 25
25 -
 26
26 -
 27
27 -
 28
28 -
 29
29 -
 30
30 -
 31
31 -
 32
32 -
 33
33 -
 34
34 -
 35
35 -
 36
36 -
 37
37 -
 38
38 -
 39
39 -
 40
40 -
41
-
42
-
43
-
44
-
45
-
46
-
47
-
48
-
49
-
50
-
51
-
52
-
53
-
54
-
55
-
56
-
57
-
58
-
59
-
60
-
61
-
62
-
63
-
64
-
65
-
66
-
67
-
68
-
69
-
70
-
71
-
72
-
73
-
74
-
75
-
76
-
77
-
78
-
79
-
80
-
81
-
82
-
83
-
84
-
85
-
86
-
87
-
88
-
89
-
90
-
91
-
92
 |
 |

Management’s Discussion and Analysis of
Financial Condition and Results of Operations
CVS CAREMARK 2012 ANNUAL REPORT
28
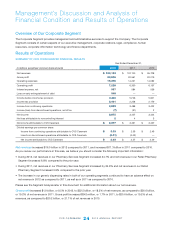
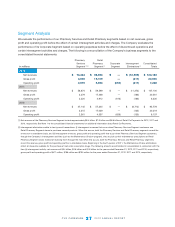
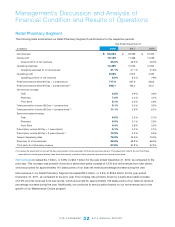
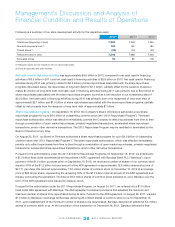
Pharmacy Services Segment
The following table summarizes our Pharmacy Services Segment’s performance for the respective periods:
Year Ended December 31,
In millions
2012 2011 2010
Net revenues $ 73,444 $ 58,874 $ 47,145
Gross profit 3,808 3,279 3,315
Grossprot%ofnetrevenues 5.2 % 5.6% 7.0%
Operating expenses 1,129 1,059 954
Operatingexpenses%ofnetrevenues 1.5 % 1.8% 2.0%
Operating profit 2,679 2,220 2,361
Operatingprot%ofnetrevenues 3.7 % 3.8% 5.0%
Net revenues (1):
Mail choice (2) $ 22,843 $ 18,616 $ 16,159
Pharmacy network (3) 50,411 40,040 30,681
Other 190 218 305
Pharmacy claims processed (1):
Total 880.5 774.6 584.7
Mail choice (2) 81.7 70.6 64.1
Pharmacy network (3) 798.8 704.0 520.6
Generic dispensing rate (1):
Total 78.5 % 74.1% 71.5%
Mail choice (2) 72.0 % 64.9% 61.3%
Pharmacy network (3) 79.1 % 75.0% 72.7%
Mail choice penetration rate 22.7 % 22.3% 25.8%
(1) Pharmacy network net revenues, claims processed and generic dispensing rates do not include Maintenance Choice, which are included within the mail
choice category.
(2) Mail choice is defined as claims filled at a Pharmacy Services’ mail facility, which includes specialty mail claims, as well as 90-day claims filled at retail
under the Maintenance Choice program.
(3) Pharmacy network is defined as claims filled at retail pharmacies, including our retail drugstores, but excluding Maintenance Choice activity.
Net revenues
inourPharmacyServicesSegmentincreased$14.6billion,or24.7%,to$73.4billionfortheyearended
December 31, 2012, as compared to the prior year. The increase in net revenues was primarily due to new client starts
on January 1, 2012, drug cost inflation and the growth of our Medicare Part D program. Conversely, the increase in our
generic dispensing rate had a negative impact on our revenue in 2012 as it did in 2011.
Netrevenuesincreased$11.7billion,or24.9%,to$58.9billionfortheyearendedDecember31,2011,ascomparedtothe
prior year. The increase in 2011 was primarily due to the addition of the long-term contract with Aetna Inc. (“Aetna”), which
became effective on January 1, 2011, as well as activity resulting from our April 29, 2011 acquisition of the UAM Medicare
Part D Business. Additionally, the increase in our generic dispensing rate had a negative impact on our revenue in 2011 as
it did in 2010.