CVS 2012 Annual Report Download - page 56
Download and view the complete annual report
Please find page 56 of the 2012 CVS annual report below. You can navigate through the pages in the report by either clicking on the pages listed below, or by using the keyword search tool below to find specific information within the annual report.-
 1
1 -
2
-
3
-
4
-
5
-
6
-
7
-
8
-
9
-
10
-
11
-
12
-
13
-
14
-
15
-
16
-
17
-
18
-
19
-
20
-
21
-
22
-
23
-
24
-
25
-
26
-
27
-
28
-
29
-
30
-
31
-
32
-
33
-
34
-
35
-
36
-
37
-
38
-
39
-
40
-
41
-
42
-
43
-
44
-
45
-
 46
46 -
 47
47 -
 48
48 -
 49
49 -
 50
50 -
 51
51 -
 52
52 -
 53
53 -
 54
54 -
 55
55 -
 56
56 -
 57
57 -
 58
58 -
 59
59 -
 60
60 -
 61
61 -
 62
62 -
 63
63 -
 64
64 -
 65
65 -
 66
66 -
67
-
68
-
69
-
70
-
71
-
72
-
73
-
74
-
75
-
76
-
77
-
78
-
79
-
80
-
81
-
82
-
83
-
84
-
85
-
86
-
87
-
88
-
89
-
90
-
91
-
92
 |
 |

CVS CAREMARK 2012 ANNUAL REPORT
54
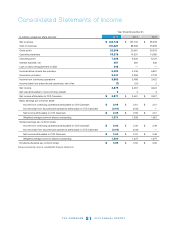
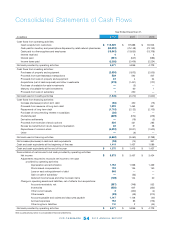
Year Ended December 31,
In millions
2012 2011 2010
Cash flows from operating activities:
Cash receipts from customers $ 113,205 $ 97,688 $ 94,503
Cash paid for inventory and prescriptions dispensed by retail network pharmacies (90,032) (75,148) (73,143)
Cash paid to other suppliers and employees (13,643) (13,635) (13,778)
Interest received 4 4 4
Interest paid (581) (647) (583)
Income taxes paid (2,282) (2,406) (2,224)
Net cash provided by operating activities 6,671 5,856 4,779
Cash flows from investing activities:
Purchases of property and equipment (2,030) (1,872) (2,005)
Proceeds from sale-leaseback transactions 529 592 507
Proceeds from sale of property and equipment 23 4 34
Acquisitions (net of cash acquired) and other investments (378) (1,441) (177)
Purchase of available-for-sale investments — (3) —
Maturity of available-for-sale investments — 60 1
Proceeds from sale of subsidiary 7 250 —
Net cash used in investing activities (1,849) (2,410) (1,640)
Cash flows from financing activities:
Increase (decrease) in short-term debt (60) 450 (15)
Proceeds from issuance of long-term debt 1,239 1,463 991
Repayments of long-term debt (1,718) (2,122) (2,103)
Purchase of noncontrolling interest in subsidiary (26) — —
Dividends paid (829) (674) (479)
Derivative settlements — (19) (5)
Proceeds from exercise of stock options 836 431 285
Excess tax benefits from stock-based compensation 28 21 28
Repurchase of common stock (4,330) (3,001) (1,500)
Other — (9) —
Net cash used in financing activities (4,860) (3,460) (2,798)
Net increase (decrease) in cash and cash equivalents (38) (14) 341
Cash and cash equivalents at the beginning of the year 1,413 1,427 1,086
Cash and cash equivalents at the end of the year $ 1,375 $ 1,413 $ 1,427
Reconciliation of net income to net cash provided by operating activities:
Net income $ 3,875 $ 3,457 $ 3,424
Adjustments required to reconcile net income to net cash
provided by operating activities:
Depreciation and amortization 1,753 1,568 1,469
Stock-based compensation 132 135 150
Loss on early extinguishment of debt 348 — —
Gain on sale of subsidiary — (53) —
Deferred income taxes and other noncash items (106) 144 30
Change in operating assets and liabilities, net of effects from acquisitions:
Accounts receivable, net (387) (748) 532
Inventories (858) 607 (352)
Other current assets 3 (420) (4)
Other assets (99) (49) (210)
Accounts payable and claims and discounts payable 1,147 1,128 (40)
Accrued expenses 753 85 (176)
Other long-term liabilities 110 2 (44)
Net cash provided by operating activities $ 6,671 $ 5,856 $ 4,779
See accompanying notes to consolidated financial statements.
Consolidated Statements of Cash Flows