CVS 2012 Annual Report Download - page 34
Download and view the complete annual report
Please find page 34 of the 2012 CVS annual report below. You can navigate through the pages in the report by either clicking on the pages listed below, or by using the keyword search tool below to find specific information within the annual report.-
 1
1 -
2
-
3
-
4
-
5
-
6
-
7
-
8
-
9
-
10
-
11
-
12
-
13
-
14
-
15
-
16
-
17
-
18
-
19
-
20
-
21
-
22
-
23
-
 24
24 -
 25
25 -
 26
26 -
 27
27 -
 28
28 -
 29
29 -
 30
30 -
 31
31 -
 32
32 -
 33
33 -
 34
34 -
 35
35 -
 36
36 -
 37
37 -
 38
38 -
 39
39 -
 40
40 -
 41
41 -
 42
42 -
 43
43 -
 44
44 -
45
-
46
-
47
-
48
-
49
-
50
-
51
-
52
-
53
-
54
-
55
-
56
-
57
-
58
-
59
-
60
-
61
-
62
-
63
-
64
-
65
-
66
-
67
-
68
-
69
-
70
-
71
-
72
-
73
-
74
-
75
-
76
-
77
-
78
-
79
-
80
-
81
-
82
-
83
-
84
-
85
-
86
-
87
-
88
-
89
-
90
-
91
-
92
 |
 |
Management’s Discussion and Analysis of
Financial Condition and Results of Operations
CVS CAREMARK 2012 ANNUAL REPORT
32
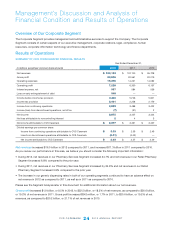
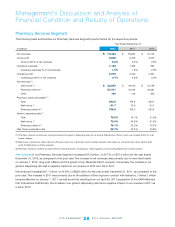
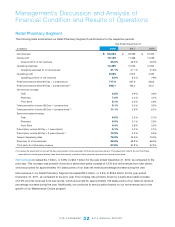
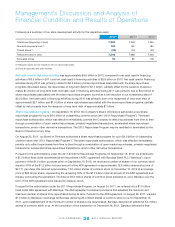
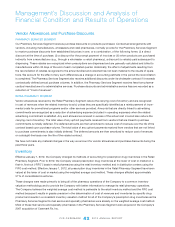
Retail Pharmacy Segment
The following table summarizes our Retail Pharmacy Segment’s performance for the respective periods:
Year Ended December 31,
In millions
2012 2011 2010
Net revenues $ 63,654 $ 59,599 $ 57,345
Gross profit 19,109 17,468 17,039
Grossprot%ofnetrevenues 30.0 % 29.3% 29.7%
Operating expenses 13,455 12,556 12,502
Operatingexpenses%ofnetrevenues 21.1 % 21.1% 21.8%
Operating profit 5,654 4,912 4,537
Operatingprot%ofnetrevenues 8.9 % 8.2% 7.9%
Retail prescriptions filled (90 Day = 1 prescription) 717.9 657.8 636.3
Retail prescriptions filled (90 Day = 3 prescriptions) (1)
848.1 763.4 723.1
Net revenue increase:
Total 6.8 % 3.9% 3.6%
Pharmacy 7.6 % 4.4% 4.1%
Front Store 5.1 % 3.0% 2.6%
Total prescription volume (90 Day = 1 prescription) 9.1 % 3.4% 3.2%
Total prescription volume (90 Day = 3 prescriptions) (1) 11.1 % 5.6% 6.1%
Same-store sales increase:
Total 5.5 % 2.3% 2.1%
Pharmacy 6.5 % 3.1% 2.9%
Front Store 3.4 % 0.8% 0.5%
Prescription volume (90 Day = 1 prescription) 8.1 % 2.2% 2.1%
Prescription volume (90 Day = 3 prescriptions) (1) 10.3 % 4.4% 6.4%
Generic dispensing rates 79.2 % 75.6% 73.0%
Pharmacy%ofnetrevenues 68.8 % 68.3% 68.0%
Thirdparty%ofpharmacyrevenue 97.5 % 97.8% 97.4%
(1) Includes the adjustment to convert 90-day prescriptions to the equivalent of three 30-day prescriptions. This adjustment reflects the fact that these
prescriptions include approximately three times the amount of product days supplied compared to a normal prescription.
Net revenues
increased$4.1billion,or6.8%,to$63.7billionfortheyearendedDecember31,2012,ascomparedtothe
prioryear.Thisincreasewasprimarilydrivenbyasamestoresalesincreaseof5.5%andnetrevenuesfromnewstores,
which accounted for approximately 110 basis points of our total net revenue percentage increase during the year.
NetrevenuesinourRetailPharmacySegmentincreased$2.3billion,or3.9%to$59.6billionfortheyearended
December 31, 2011, as compared to the prior year. This increase was primarily driven by a same store sales increase
of2.3%andnetrevenuesfromnewstores,whichaccountedforapproximately130basispointsofourtotalnetrevenue
percentage increase during the year. Additionally, we continued to see a positive impact on our net revenues due to the
growth of our Maintenance Choice program.