CVS 2012 Annual Report Download - page 35
Download and view the complete annual report
Please find page 35 of the 2012 CVS annual report below. You can navigate through the pages in the report by either clicking on the pages listed below, or by using the keyword search tool below to find specific information within the annual report.-
 1
1 -
2
-
3
-
4
-
5
-
6
-
7
-
8
-
9
-
10
-
11
-
12
-
13
-
14
-
15
-
16
-
17
-
18
-
19
-
20
-
21
-
22
-
23
-
24
-
 25
25 -
 26
26 -
 27
27 -
 28
28 -
 29
29 -
 30
30 -
 31
31 -
 32
32 -
 33
33 -
 34
34 -
 35
35 -
 36
36 -
 37
37 -
 38
38 -
 39
39 -
 40
40 -
 41
41 -
 42
42 -
 43
43 -
 44
44 -
 45
45 -
46
-
47
-
48
-
49
-
50
-
51
-
52
-
53
-
54
-
55
-
56
-
57
-
58
-
59
-
60
-
61
-
62
-
63
-
64
-
65
-
66
-
67
-
68
-
69
-
70
-
71
-
72
-
73
-
74
-
75
-
76
-
77
-
78
-
79
-
80
-
81
-
82
-
83
-
84
-
85
-
86
-
87
-
88
-
89
-
90
-
91
-
92
 |
 |
CVS CAREMARK 2012 ANNUAL REPORT
33
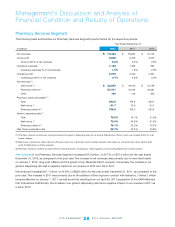
As you review our Retail Pharmacy Segment’s performance in this area, we believe you should consider the following
important information:
• Frontstoresamestoresalesrose5.1%intheyearendedDecember31,2012,ascomparedtotheprioryear.Frontstore
same store sales were positively impacted by increased customer traffic resulting from new store growth, the contractual
impasse between Express Scripts and Walgreens and an additional day as a result of 2012 being a leap year.
• Pharmacysamestoresalesrose7.6%intheyearendedDecember31,2012,ascomparedtotheprioryear.The
contractual impasse between Express Scripts and Walgreens was a significant driver of the increase. Pharmacy same
store sales also benefited from an additional day as a result of 2012 being a leap year.
• Pharmacyrevenuescontinuetobenegativelyimpactedbytheconversionofbrandnamedrugstoequivalentgeneric
drugs, which typically have a lower selling price. Pharmacy same store sales were negatively impacted by approximately
700 and 215 basis points for the years ended December 31, 2012 and 2011, respectively, due to recent generic introduc-
tions. In addition, our pharmacy growth has also been adversely affected by the lack of significant new brand name drug
introductions, higher consumer co-payments and co-insurance arrangements and an increase in the number of over-the-
counter remedies that were historically only available by prescription.
• AsofDecember31,2012,weoperated7,458retailstorescomparedto7,327retailstoresasofDecember31,2011and
7,182 retail stores as of December 31, 2010. Total net revenues from new stores (excluding acquired stores) contributed
approximately1.1%,1.3%and1.4%toourtotalnetrevenuepercentageincreasein2012,2011,and2010,respectively.
• PharmacyrevenuegrowthcontinuedtobenetfromincreasedutilizationbyMedicarePartDbeneciaries,theability
to attract and retain managed care customers and favorable industry trends. These trends include an aging American
population; many “baby boomers” are now in their fifties and sixties and are consuming a greater number of prescription
drugs. In addition, the increased use of pharmaceuticals as the first line of defense for individual health care also
contributed to the growing demand for pharmacy services. We believe these favorable industry trends will continue.
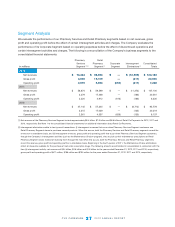
Gross profit
in our Retail Pharmacy Segment includes net revenues less the cost of merchandise sold during the reporting
period and the related purchasing costs, warehousing costs, delivery costs and actual and estimated inventory losses.
Grossprotincreased$1.6billion,or9.4%,to$19.1billionintheyearendedDecember31,2012,ascomparedtotheprior
year.Grossprotasapercentageofnetrevenuesincreasedto30.0%inyearendedDecember31,2012,from29.3%in
2011. The increase in gross profit dollars in the year ended December 31, 2012, was primarily driven by same store sales
increases. The increase in gross profit as a percentage of revenue was primarily driven by increased pharmacy margins due
to the positive impact of increased generic drugs dispensed, partially offset by continued reimbursement pressure and
lower front store margins.
Grossprotincreased$429million,or2.5%,to$17.5billionfortheyearendedDecember31,2011,ascomparedto
theprioryear.Grossprotasapercentageofnetrevenuesdecreasedto29.3%fortheyearendedDecember31,2011,
comparedto29.7%fortheprioryear.Grossprotasapercentageofrevenuewasnegativelyimpactedduring2011by
lower pharmacy margins due to continued reimbursement pressure, which was partially offset by the positive impact of
increased generic drugs dispensed.
As you review our Retail Pharmacy Segment’s performance in this area, we believe you should consider the following
important information:
• Grossprotwaspositivelyimpactedbyapproximately$31millionfortheyearendedDecember31,2012asaresultof
the change in inventory accounting methods described in Note 2 to our consolidated financial statements. The impact of
this change on gross profit as a percentage of net revenues for the year ended December 31, 2012 was approximately
five basis points.