CVS 2012 Annual Report Download - page 31
Download and view the complete annual report
Please find page 31 of the 2012 CVS annual report below. You can navigate through the pages in the report by either clicking on the pages listed below, or by using the keyword search tool below to find specific information within the annual report.-
 1
1 -
2
-
3
-
4
-
5
-
6
-
7
-
8
-
9
-
10
-
11
-
12
-
13
-
14
-
15
-
16
-
17
-
18
-
19
-
20
-
 21
21 -
 22
22 -
 23
23 -
 24
24 -
 25
25 -
 26
26 -
 27
27 -
 28
28 -
 29
29 -
 30
30 -
 31
31 -
 32
32 -
 33
33 -
 34
34 -
 35
35 -
 36
36 -
 37
37 -
 38
38 -
 39
39 -
 40
40 -
 41
41 -
42
-
43
-
44
-
45
-
46
-
47
-
48
-
49
-
50
-
51
-
52
-
53
-
54
-
55
-
56
-
57
-
58
-
59
-
60
-
61
-
62
-
63
-
64
-
65
-
66
-
67
-
68
-
69
-
70
-
71
-
72
-
73
-
74
-
75
-
76
-
77
-
78
-
79
-
80
-
81
-
82
-
83
-
84
-
85
-
86
-
87
-
88
-
89
-
90
-
91
-
92
 |
 |
CVS CAREMARK 2012 ANNUAL REPORT
29
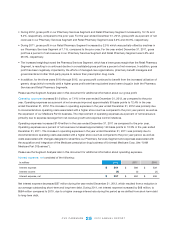
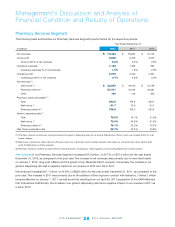
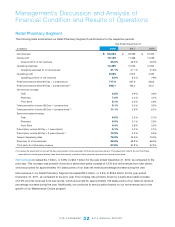
As you review our Pharmacy Services Segment’s revenue performance, we believe you should also consider the following
important information:
• Ourmailchoiceclaimsprocessedincreased15.7%to81.7millionclaimsintheyearendedDecember31,2012,
compared to 70.6 million claims in the prior year. The increase in mail choice claim volume was primarily due to a
significant number of 2012 new client starts, as well as increased claims associated with the continuing client adoption
ofourMaintenanceChoiceprogram.During2011,ourmailchoiceclaimsprocessedincreased10.2%to70.6million
claims. The increase in mail choice claim volume was primarily due to the addition of the long-term contract with Aetna,
which became effective on January 1, 2011.
• During2012and2011,ouraveragerevenuepermailchoiceclaimincreasedby6.0%and4.6%,comparedto2011and
2010, respectively. This increase was primarily due to drug cost inflation particularly in our specialty business.
• Ourmailchoicegenericdispensingratewas72.0%,64.9%and61.3%intheyearsendedDecember31,2012,2011
and 2010, respectively.
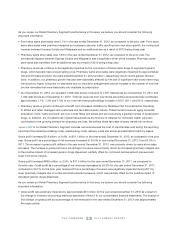
• Ourpharmacynetworkgenericdispensingrateincreasedto79.1%intheyearendedDecember31,2012,compared
to75.0%intheprioryear.During2011,ourpharmacynetworkgenericdispensingrateincreasedto75.0%compared
toourpharmacynetworkgenericdispensingrateof72.7%in2010.Thesecontinuedincreasesinbothmailchoiceand
pharmacy network generic dispensing rates were primarily due to the impact of new generic drug introductions and our
continuous efforts to encourage plan members to use generic drugs when they are available. We believe our generic
dispensing rates will continue to increase in future periods. This increase will be affected by, among other things, the
number of new generic drug introductions and our success at encouraging plan members to utilize generic drugs when
they are available and clinically appropriate.
• Ourpharmacynetworkclaimsprocessedincreased13.5%to798.8millionclaimsintheyearendedDecember31,2012,
compared to 704.0 million claims in the prior year. The increase in the pharmacy network claim volume was primarily
due to a large number of 2012 new client starts, as well as higher claims activity associated with our Medicare Part D
program.During2011,ourpharmacynetworkclaimsprocessedincreased35.2%to704.0millioncomparedto520.6million
pharmacy network claims processed in 2010. The increase in the pharmacy network claim volume was primarily due to
the addition of the long-term contract with Aetna, which became effective on January 1, 2011. Additionally, we experi-
enced higher claims activity associated with our Medicare Part D program as a result of our acquisition of the UAM
Medicare Part D Business completed during the second quarter of 2011 and increases in covered lives under our legacy
Medicare Part D program.
• Ouraveragerevenueperpharmacynetworkclaimprocessedincreased11.0%intheyearendedDecember31,2012
as compared to the prior year. This increase was primarily due to drug cost inflation partially offset by increases in the
genericdispensingrate.During2011,ouraveragerevenueperpharmacynetworkclaimprocesseddecreasedby3.5%,
compared to 2010. This decrease was primarily due to increases in the percentage of generic prescription drugs
dispensed, changes in client pricing, and the impact of our acquisition of the UAM Medicare Part D Business, partially
offset by our long-term contract with Aetna, which became effective on January 1, 2011.
• During2012,2011,and2010,wegeneratednetrevenuesfromourparticipationintheadministrationoftheMedicare
Part D drug benefit by providing PBM services to our health plan clients and other clients that have qualified as a Medicare
Part D Prescription Drug Plan (a “PDP”) under regulations promulgated by the Centers for Medicare and Medicaid
Services (“CMS”). We are also a national provider of drug benefits to eligible beneficiaries under the Medicare Part D
program through our subsidiaries, SilverScript and Pennsylvania Life (which have been approved by CMS as PDPs).