CVS 2012 Annual Report Download - page 32
Download and view the complete annual report
Please find page 32 of the 2012 CVS annual report below. You can navigate through the pages in the report by either clicking on the pages listed below, or by using the keyword search tool below to find specific information within the annual report.-
 1
1 -
2
-
3
-
4
-
5
-
6
-
7
-
8
-
9
-
10
-
11
-
12
-
13
-
14
-
15
-
16
-
17
-
18
-
19
-
20
-
21
-
 22
22 -
 23
23 -
 24
24 -
 25
25 -
 26
26 -
 27
27 -
 28
28 -
 29
29 -
 30
30 -
 31
31 -
 32
32 -
 33
33 -
 34
34 -
 35
35 -
 36
36 -
 37
37 -
 38
38 -
 39
39 -
 40
40 -
 41
41 -
 42
42 -
43
-
44
-
45
-
46
-
47
-
48
-
49
-
50
-
51
-
52
-
53
-
54
-
55
-
56
-
57
-
58
-
59
-
60
-
61
-
62
-
63
-
64
-
65
-
66
-
67
-
68
-
69
-
70
-
71
-
72
-
73
-
74
-
75
-
76
-
77
-
78
-
79
-
80
-
81
-
82
-
83
-
84
-
85
-
86
-
87
-
88
-
89
-
90
-
91
-
92
 |
 |
Management’s Discussion and Analysis of
Financial Condition and Results of Operations
CVS CAREMARK 2012 ANNUAL REPORT
30
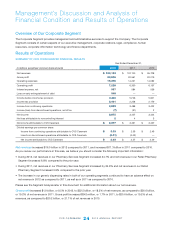
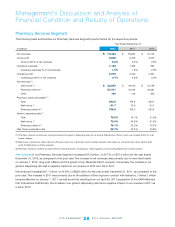
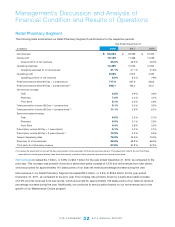
• ThePharmacyServicesSegmentrecognizesrevenuesforitspharmacynetworktransactionsbasedonindividual
contract terms. In accordance with ASC 605,
Revenue Recognition
, Caremark’s contracts are predominantly accounted
for using the gross method.
Gross profit
in our Pharmacy Services Segment includes net revenues less cost of revenues. Cost of revenues includes
(i) the cost of pharmaceuticals dispensed, either directly through our mail service and specialty retail pharmacies or
indirectly through our pharmacy network, (ii) shipping and handling costs and (iii) the operating costs of our mail service
pharmacies, customer service operations and related information technology support.
Grossprotincreased$529million,or16.1%,to$3.8billionintheyearendedDecember31,2012,ascomparedtothe
prioryear.Grossprotasapercentageofnetrevenueswas5.2%fortheyearendedDecember31,2012,comparedto
5.6%intheprioryear.TheincreaseingrossprotdollarsintheyearendedDecember31,2012wasprimarilyduetoa
significant number of 2012 new client starts, an increase in generic dispensing and drug cost inflation. The decrease in
gross profit as a percentage of revenue was driven primarily by client pricing compression, increased payroll and other
expenses associated with our mail and specialty operations, and expanding Medicare Part D operations, which has lower
margins. The increase in expenses associated with our mail operations was the result of the significant number of 2012
new client starts.
During2011,grossprotdecreased$36million,or1.1%,to$3.3billionfortheyearendedDecember31,2011,ascom-
paredtotheprioryear.Grossprotasapercentageofnetrevenueswas5.6%fortheyearendedDecember31,2011,
comparedto7.0%intheprioryear.ThedecreaseingrossprotdollarsintheyearendedDecember31,2011wasprimarily
driven by pricing compression relating to contract renewals and in particular the renewal of a large government client
contract that took effect during the third quarter of 2010 partially offset by activity associated with our April 2011 acquisi-
tion of the UAM Medicare Part D Business.
During the year ended December 31, 2011, the decrease in gross profit as a percentage of net revenues was also driven by
the previously mentioned client pricing compression, as well as the profitability associated with our long-term contract with
Aetna, which has lower margins. These factors were partially offset by the positive impact from the above mentioned
increases in our generic dispensing rates as compared to the prior year.
As you review our Pharmacy Services Segment’s performance in this area, we believe you should consider the following
important information:
• Ourgrossprotdollarsandgrossprotasapercentageofnetrevenuescontinuedtobeimpactedbyoureffortsto
(i) retain existing clients, (ii) obtain new business and (iii) maintain or improve the rebates and/or discounts we received
from manufacturers, wholesalers and retail pharmacies. In particular, competitive pressures in the PBM industry have
caused us and other PBMs to continue to share a larger portion of rebates and/or discounts received from pharmaceuti-
cal manufacturers. In addition, market dynamics and regulatory changes have impacted our ability to offer plan sponsors
pricing that includes retail network “differential” or “spread”. We expect these trends to continue. The “differential” or
“spread” is any difference between the drug price charged to plan sponsors, including Medicare Part D plan sponsors,
by a PBM and the price paid for the drug by the PBM to the dispensing provider. The increased use of generic drugs
has positively impacted our gross profit margins but has resulted in third party payors augmenting their efforts to reduce
reimbursement payments for prescriptions. This trend, which we expect to continue, reduces the benefit we realize from
brand to generic product conversions.