CVS 2012 Annual Report Download - page 77
Download and view the complete annual report
Please find page 77 of the 2012 CVS annual report below. You can navigate through the pages in the report by either clicking on the pages listed below, or by using the keyword search tool below to find specific information within the annual report.-
 1
1 -
2
-
3
-
4
-
5
-
6
-
7
-
8
-
9
-
10
-
11
-
12
-
13
-
14
-
15
-
16
-
17
-
18
-
19
-
20
-
21
-
22
-
23
-
24
-
25
-
26
-
27
-
28
-
29
-
30
-
31
-
32
-
33
-
34
-
35
-
36
-
37
-
38
-
39
-
40
-
41
-
42
-
43
-
44
-
45
-
46
-
47
-
48
-
49
-
50
-
51
-
52
-
53
-
54
-
55
-
56
-
57
-
58
-
59
-
60
-
61
-
62
-
63
-
64
-
65
-
66
-
 67
67 -
 68
68 -
 69
69 -
 70
70 -
 71
71 -
 72
72 -
 73
73 -
 74
74 -
 75
75 -
 76
76 -
 77
77 -
 78
78 -
 79
79 -
 80
80 -
 81
81 -
 82
82 -
 83
83 -
 84
84 -
 85
85 -
 86
86 -
 87
87 -
88
-
89
-
90
-
91
-
92
 |
 |
CVS CAREMARK 2012 ANNUAL REPORT
75
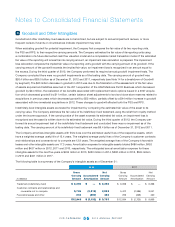
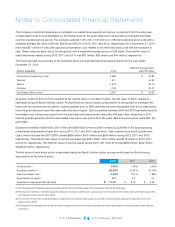
As of December 31, 2012, unrecognized compensation expense related to unvested options totaled $161 million, which
the Company expects to be recognized over a weighted-average period of 2.18 years. After considering anticipated
forfeitures, the Company expects approximately 21 million of the unvested options to vest over the requisite service period.
The following table is a summary of the Company’s stock option activity for the year ended December 31, 2012:
Weighted Average
Weighted Average Remaining Aggregate Intrinsic
Shares in thousands Shares Exercise Price Contractual Term Value
Outstanding at December 31, 2011 59,107 $ 33.40 4.11 $ 439,671,000
Granted 8,759 $ 45.02 — —
Exercised (24,978) $ 32.29 — —
Forfeited (1,511) $ 35.80 — —
Expired (448) $ 25.29 — —
Outstanding at December 31, 2012 40,929 $ 36.57 4.34 $ 482,249,000
Exercisable at December 31, 2012 18,875 $ 34.23 2.99 $ 266,505,000
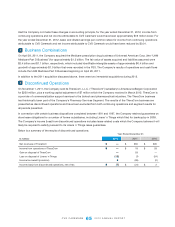
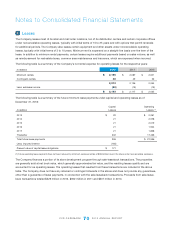
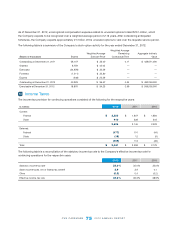
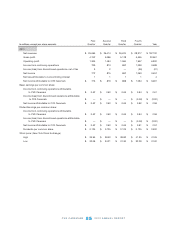
12 Income Taxes
The income tax provision for continuing operations consisted of the following for the respective years:
In millions 2012 2011 2010
Current:
Federal $ 2,226 $ 1,807 $ 1,884
State 410 338 344
2,636 2,145 2,228
Deferred:
Federal (177) 101 (44)
State (18) 12 (5)
(195) 113 (49)
Total $ 2,441 $ 2,258 $ 2,179
The following table is a reconciliation of the statutory income tax rate to the Company’s effective income tax rate for
continuing operations for the respective years:
2012 2011 2010
Statutory income tax rate 35.0 % 35.0% 35.0%
State income taxes, net of federal tax benefit 3.9 3.9 4.1
Other (0.3) 0.4 (0.2)
Effective income tax rate 38.6 % 39.3% 38.9%
12