CVS 2012 Annual Report Download - page 36
Download and view the complete annual report
Please find page 36 of the 2012 CVS annual report below. You can navigate through the pages in the report by either clicking on the pages listed below, or by using the keyword search tool below to find specific information within the annual report.-
 1
1 -
2
-
3
-
4
-
5
-
6
-
7
-
8
-
9
-
10
-
11
-
12
-
13
-
14
-
15
-
16
-
17
-
18
-
19
-
20
-
21
-
22
-
23
-
24
-
25
-
 26
26 -
 27
27 -
 28
28 -
 29
29 -
 30
30 -
 31
31 -
 32
32 -
 33
33 -
 34
34 -
 35
35 -
 36
36 -
 37
37 -
 38
38 -
 39
39 -
 40
40 -
 41
41 -
 42
42 -
 43
43 -
 44
44 -
 45
45 -
 46
46 -
47
-
48
-
49
-
50
-
51
-
52
-
53
-
54
-
55
-
56
-
57
-
58
-
59
-
60
-
61
-
62
-
63
-
64
-
65
-
66
-
67
-
68
-
69
-
70
-
71
-
72
-
73
-
74
-
75
-
76
-
77
-
78
-
79
-
80
-
81
-
82
-
83
-
84
-
85
-
86
-
87
-
88
-
89
-
90
-
91
-
92
 |
 |
Management’s Discussion and Analysis of
Financial Condition and Results of Operations
CVS CAREMARK 2012 ANNUAL REPORT
34
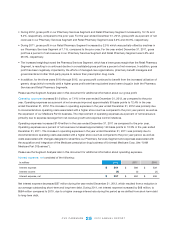
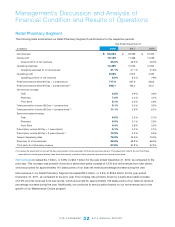
• Onaverage,ourgrossprotonfront-storerevenuesisgenerallyhigherthanouraveragegrossprotonpharmacy
revenues.Front-storerevenueswere31.2%,31.7%and32.0%oftotalrevenues,in2012,2011and2010,respectively.
Pharmacyrevenueswere68.8%,68.3%and68.0%oftotalrevenues,in2012,2011and2010,respectively.Thisshiftin
sales mix had a negative effect on our overall gross profit for the year ended December 31, 2012 and 2011, respectively.
• During2011,ourfront-storegrossprotratewaspositivelyimpactedbyprivatelabelandproprietarybrandproduct
sales, which normally yield a higher gross profit rate than other front-store products.
• Ourpharmacygrossprotrateshavebeenadverselyaffectedbytheeffortsofmanagedcareorganizations,pharmacy
benefit managers and governmental and other third-party payors to reduce their prescription drug costs. In the event this
trend continues, we may not be able to sustain our current rate of revenue growth and gross profit dollars could be
adversely impacted.
• Theincreaseduseofgenericdrugshaspositivelyimpactedourgrossprotmarginsbuthasresultedinthirdparty
payors augmenting their efforts to reduce reimbursement payments to retail pharmacies for prescriptions. This trend,
which we expect to continue, reduces the benefit we realize from brand to generic product conversions.
• Salestocustomerscoveredbythirdpartyinsuranceprogramsarealargecomponentofourtotalpharmacybusiness.
On average, our gross profit on third party pharmacy revenues is lower than our gross profit on cash pharmacy revenues.
Thirdpartypharmacyrevenueswere97.5%ofpharmacyrevenuesin2012,comparedto97.8%and97.4%ofpharmacy
revenues in 2011 and 2010, respectively.
• TheMedicarePartDprogramisincreasingprescriptionutilization.However,itisalsodecreasingourpharmacygross
profit rates as our higher gross profit business continued to migrate to Part D coverage during 2012, 2011 and 2010.
• ThePatientProtectionandAffordableCareActandtheHealthCareandEducationReconciliationAct(collectively,
“ACA”) made several significant changes to Medicaid rebates and to reimbursement. One of these changes was to
revise the definition of Average Manufacturer Price and the reimbursement formula for multi-source drugs. CMS has not
yet issued final regulations implementing these changes. Therefore, we cannot predict the effect these changes will have
on Medicaid reimbursement or their impact on the Company. See “Government Regulation” within Part I, Item 1,
Business, for additional information.
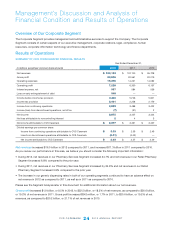
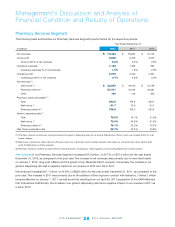
Operating expenses
in our Retail Pharmacy Segment include store payroll, store employee benefits, store occupancy
costs, selling expenses, advertising expenses, depreciation and amortization expense and certain administrative expenses.
Operatingexpensesincreased$899million,or7.2%to$13.5billion,or21.1%asapercentageofnetrevenues,inthe
yearendedDecember31,2012,ascomparedto$12.6billion,or21.1%asapercentageofnetrevenues,intheprioryear.
Operating expenses as a percentage of net revenues remained consistent with the prior year period. The increase in
operating expense dollars was the result of higher store operating costs associated with our increased store count.
Operatingexpensesincreased$54million,orlessthan1%,to$12.6billion,or21.1%asapercentageofnetrevenues,in
theyearendedDecember31,2011,ascomparedto$12.5billion,or21.8%asapercentageofnetrevenues,intheprior
year. We saw improvement in operating expenses as a percentage of net revenues for the year ended December 31, 2011,
due to improved expense leverage from our same store sales growth and expense control initiatives.