CVS 2012 Annual Report Download - page 37
Download and view the complete annual report
Please find page 37 of the 2012 CVS annual report below. You can navigate through the pages in the report by either clicking on the pages listed below, or by using the keyword search tool below to find specific information within the annual report.-
 1
1 -
2
-
3
-
4
-
5
-
6
-
7
-
8
-
9
-
10
-
11
-
12
-
13
-
14
-
15
-
16
-
17
-
18
-
19
-
20
-
21
-
22
-
23
-
24
-
25
-
26
-
 27
27 -
 28
28 -
 29
29 -
 30
30 -
 31
31 -
 32
32 -
 33
33 -
 34
34 -
 35
35 -
 36
36 -
 37
37 -
 38
38 -
 39
39 -
 40
40 -
 41
41 -
 42
42 -
 43
43 -
 44
44 -
 45
45 -
 46
46 -
 47
47 -
48
-
49
-
50
-
51
-
52
-
53
-
54
-
55
-
56
-
57
-
58
-
59
-
60
-
61
-
62
-
63
-
64
-
65
-
66
-
67
-
68
-
69
-
70
-
71
-
72
-
73
-
74
-
75
-
76
-
77
-
78
-
79
-
80
-
81
-
82
-
83
-
84
-
85
-
86
-
87
-
88
-
89
-
90
-
91
-
92
 |
 |
CVS CAREMARK 2012 ANNUAL REPORT
35
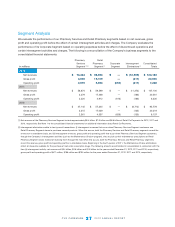
Corporate Segment
Operating expenses
increased$78million,or12.5%,to$694millionintheyearendedDecember31,2012,ascompared
totheprioryear.Operatingexpensesdecreased$10million,or1.6%during2011.OperatingexpenseswithintheCorporate
Segment include executive management, corporate relations, legal, compliance, human resources, corporate information
technology and finance related costs.
The increase in operating expenses in 2012 was primarily due to higher benefit costs and information technology
expenses. The decrease in operating expenses in 2011 was primarily driven by lower professional fees for legal services
and lower consulting costs.
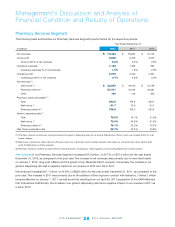
Liquidity and Capital Resources
We maintain a level of liquidity sufficient to allow us to cover our cash needs in the short-term. Over the long-term, we
manage our cash and capital structure to maximize shareholder return, maintain our financial position and maintain flexibility
for future strategic initiatives. We continuously assess our working capital needs, debt and leverage levels, capital expendi-
ture requirements, dividend payouts, potential share repurchases and future investments or acquisitions. We believe our
operating cash flows, commercial paper program, sale-leaseback program, as well as any potential future borrowings, will
be sufficient to fund these future payments and long-term initiatives.
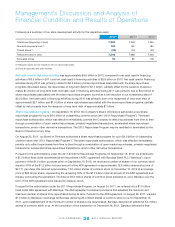
Net cash provided by operating activities
was $6.7 billion for the year ended December 31, 2012, compared to $5.9 billion
in 2011, and $4.8 billion in 2010. The increase in 2012 was primarily due to the significant increase in net income, improved
receivables management, improved payables management, and the timing of payments. The increase in 2011 was related
to improvements in inventory and payables management, increases in accrued expenses due to the timing of payments
and growth in claims payable due to increased volume of activity in our Pharmacy Services Segment, partially offset by
increased accounts receivable.
Net cash used in investing activities
was $1.8 billion, representing a decrease of $561 million in 2012. This compares to
approximately $2.4 billion and $1.6 billion in 2011 and 2010, respectively. The decrease in 2012 was primarily due to the
$1.3 billion acquisition of the UAM Medicare Part D Business which occurred in April 2011. In 2011, the increase in net
cash used in investing activities was primarily due to the cash paid to acquire the UAM Medicare Part D Business, partially
offset by the proceeds from the sale of our TheraCom subsidiary, increased proceeds from sale-lease back transactions
and lower purchases of property and equipment.
In 2012, gross capital expenditures totaled $2.0 billion, an increase of $158 million compared to the prior year. During 2012,
approximately45%ofourtotalcapitalexpenditureswerefornewstoreconstruction,40%wereforstoreexpansionand
improvementsand15%werefortechnologyandothercorporateinitiatives.Grosscapitalexpenditurestotaledapproxi-
mately $1.9 billion during 2011, compared to approximately $2.0 billion in 2010. The decrease in gross capital expenditures
during 2011 was primarily due to the absence of spending which occurred in 2010 related to store remodeling. During
2011,approximately46%ofourtotalcapitalexpenditureswerefornewstoreconstruction,18%wereforstoreexpansion
andimprovementsand36%werefortechnologyandothercorporateinitiatives.
Proceeds from sale-leaseback transactions totaled $529 million in 2012. This compares to $592 million in 2011 and
$507 million in 2010. Under the sale-leaseback transactions, the properties are generally sold at net book value, which
generally approximates fair value, and the resulting leases qualify and are accounted for as operating leases. The specific
timing and amount of future sale-leaseback transactions will vary depending on future market conditions and other factors.