CVS 2012 Annual Report Download - page 4
Download and view the complete annual report
Please find page 4 of the 2012 CVS annual report below. You can navigate through the pages in the report by either clicking on the pages listed below, or by using the keyword search tool below to find specific information within the annual report.-
 1
1 -
 2
2 -
 3
3 -
 4
4 -
 5
5 -
 6
6 -
 7
7 -
 8
8 -
 9
9 -
 10
10 -
 11
11 -
 12
12 -
 13
13 -
 14
14 -
 15
15 -
16
-
17
-
18
-
19
-
20
-
21
-
22
-
23
-
24
-
25
-
26
-
27
-
28
-
29
-
30
-
31
-
32
-
33
-
34
-
35
-
36
-
37
-
38
-
39
-
40
-
41
-
42
-
43
-
44
-
45
-
46
-
47
-
48
-
49
-
50
-
51
-
52
-
53
-
54
-
55
-
56
-
57
-
58
-
59
-
60
-
61
-
62
-
63
-
64
-
65
-
66
-
67
-
68
-
69
-
70
-
71
-
72
-
73
-
74
-
75
-
76
-
77
-
78
-
79
-
80
-
81
-
82
-
83
-
84
-
85
-
86
-
87
-
88
-
89
-
90
-
91
-
92
 |
 |

adhere to their prescription drug regimens cost the U.S.
health care system an estimated $300 billion annually in
avoidable health care costs.
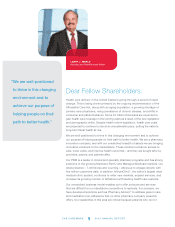
Before I expand on these and other topics, I want to
provide a brief overview of our 2012 results. By virtually
any measure, the past year was an outstanding one for
CVS Caremark.
Solid growth and significant free cash flow are
driving shareholder value
Net revenues increased 15 percent to a record
$123 billion in 2012. Excluding the loss on early
extinguishment of debt during the fourth quarter,
adjusted earnings per share from continuing operations
rose 22.8 percent to $3.43. We achieved solid growth
in our core pharmacy services and retail businesses,
and our stores captured a significant share of Express
Scripts members during its impasse with Walgreens.
We also controlled expenses and increased productivity
across the enterprise.
Our shares performed well, returning 20.3 percent for
the year. That surpassed the total returns of both the
S&P 500 Index and Dow Jones Industrial Average over
the same period. In fact, we outperformed these broader
indices on a three- and five-year basis as well.
We remain focused on enhancing shareholder value
by driving productive, long-term growth, generating
significant cash flow, and optimizing capital deployment.
In 2012, free cash flow totaled $5.2 billion and we
returned more than $5.1 billion to shareholders through
dividends and share repurchases. We increased our
quarterly dividend by 30 percent in 2012, and we
recently announced another 38 percent increase for
2013. This most recent increase allows us to meet the
low end of our 25 to 30 percent dividend payout ratio
target two years early and marks our 10th consecutive
year of dividend increases.
With our strong balance sheet and investment grade
credit rating, we also were able to take advantage of a
favorable interest rate environment to refinance a portion
of our long-term debt. Our enhanced debt structure will
help improve earnings and further enhance our free
cash flow in future years.
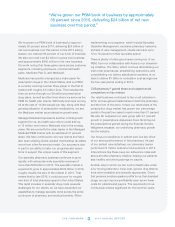
Our PBM won business across customer segments
and is well-positioned in major growth areas
Our integrated model has been embraced by the market-
place and now represents a sustainable competitive
advantage in the industry. Clients recognize that our
differentiated PBM offerings such as Pharmacy Advisor
and Maintenance Choice® can make a real difference
in enhancing access, lowering health care costs, and
improving health outcomes.
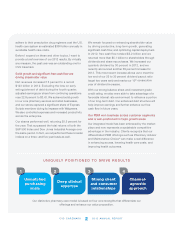
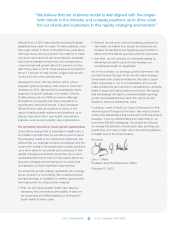
Unmatched
purchasing
scale
Deep clinical
expertise
Strong client
and consumer
relationships
Channel-
agnostic
approach
UNIQUELY POSITIONED TO DRIVE RESULTS
Our distinctive pharmacy care model is based on four core strengths that differentiate our
offerings and enhance our value proposition.
1
2
3
4
CVS CAREMARK 2012 ANNUAL REPORT
2