CVS 2012 Annual Report Download - page 33
Download and view the complete annual report
Please find page 33 of the 2012 CVS annual report below. You can navigate through the pages in the report by either clicking on the pages listed below, or by using the keyword search tool below to find specific information within the annual report.-
 1
1 -
2
-
3
-
4
-
5
-
6
-
7
-
8
-
9
-
10
-
11
-
12
-
13
-
14
-
15
-
16
-
17
-
18
-
19
-
20
-
21
-
22
-
 23
23 -
 24
24 -
 25
25 -
 26
26 -
 27
27 -
 28
28 -
 29
29 -
 30
30 -
 31
31 -
 32
32 -
 33
33 -
 34
34 -
 35
35 -
 36
36 -
 37
37 -
 38
38 -
 39
39 -
 40
40 -
 41
41 -
 42
42 -
 43
43 -
44
-
45
-
46
-
47
-
48
-
49
-
50
-
51
-
52
-
53
-
54
-
55
-
56
-
57
-
58
-
59
-
60
-
61
-
62
-
63
-
64
-
65
-
66
-
67
-
68
-
69
-
70
-
71
-
72
-
73
-
74
-
75
-
76
-
77
-
78
-
79
-
80
-
81
-
82
-
83
-
84
-
85
-
86
-
87
-
88
-
89
-
90
-
91
-
92
 |
 |
CVS CAREMARK 2012 ANNUAL REPORT
31
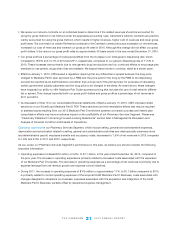
• Wereviewournetworkcontractsonanindividualbasistodetermineiftherelatedrevenuesshouldbeaccountedfor
using the gross method or net method under the applicable accounting rules. Caremark’s network contracts are predom-
inantly accounted for using the gross method, which results in higher revenues, higher cost of revenues and lower gross
profit rates. The conversion of certain RxAmerica contracts to the Caremark contract structure increased our net revenues,
increased our cost of revenues and lowered our gross profit rates in 2010. Although this change did not affect our gross
profit dollars, it did reduce our gross profit rates by approximately 40 basis points in the year ended December 31, 2010.
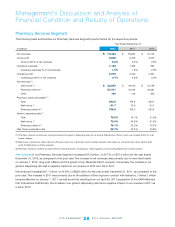
• Ourgrossprotasapercentageofrevenuesbenetedfromtheincreaseinourtotalgenericdispensingrate,which
increasedto78.5%and74.1%in2012and2011,respectively,comparedtoourgenericdispensingrateof71.5%in
2010. These increases were primarily due to new generic drug introductions and our continued efforts to encourage plan
members to use generic drugs when they are available. We expect these trends to continue, albeit at a slower pace.
• EffectiveJanuary1,2010,CMSissuedaregulationrequiringthatanydifferentialorspreadbetweenthedrugprice
charged to Medicare Part D plan sponsors by a PBM and the price paid for the drug by the PBM to the dispensing
provider be reported as an administrative cost rather than a drug cost of the plan sponsor for purposes of calculating
certain government subsidy payments and the drug price to be charged to enrollees. As noted above, these changes
have impacted our ability to offer Medicare Part D plan sponsors pricing that includes the use of retail network differen-
tial or spread. This change impacted both our gross profit dollars and gross profit as a percentage of net revenues in
2011 and 2010.
• AsdiscussedinNote13toourconsolidatednancialstatements,effectiveJanuary15,2013,CMSimposedcertain
sanctions on our SilverScript Medicare Part D PDP. These sanctions and the remediation efforts that may be required
to address issues resulting from our 2013 Medicare Part D enrollment systems conversion process and related plan
consolidation efforts may have an adverse impact on the profitability of our Pharmacy Services Segment. Please see
“Cautionary Statement Concerning Forward-Looking Statements” section later in Management’s Discussion and
Analysis of Financial Condition and Results of Operations.
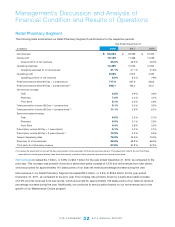
Operating expenses
in our Pharmacy Services Segment, which include selling, general and administrative expenses,
depreciation and amortization related to selling, general and administrative activities and retail specialty pharmacy store
andadministrativepayroll,employeebenetsandoccupancycosts,decreasedto1.5%ofnetrevenuesin2012compared
to1.8%and2.0%in2011and2010,respectively.
As you review our Pharmacy Services Segment’s performance in this area, we believe you should consider the following
important information:
• Operatingexpensesincreased$70millionor6.6%,to$1.1billion,intheyearendedDecember30,2012,comparedto
the prior year. The increase in operating expenses is primarily related to increased costs associated with the expansion
of our Medicare Part D business. The decrease in operating expenses as a percentage of net revenues is primarily due to
expense leverage from net revenue growth and expense control initiatives.
• During2011,theincreaseinoperatingexpensesof$105millionorapproximately11%,to$1.1billioncomparedto2010,
is primarily related to normal operating expenses of the acquired UAM Medicare Part D Business, costs associated with
changes designed to streamline our business, expenses associated with the acquisition and integration of the UAM
Medicare Part D Business, partially offset by disciplined expense management.