CVS 2012 Annual Report Download - page 27
Download and view the complete annual report
Please find page 27 of the 2012 CVS annual report below. You can navigate through the pages in the report by either clicking on the pages listed below, or by using the keyword search tool below to find specific information within the annual report.-
 1
1 -
2
-
3
-
4
-
5
-
6
-
7
-
8
-
9
-
10
-
11
-
12
-
13
-
14
-
15
-
16
-
 17
17 -
 18
18 -
 19
19 -
 20
20 -
 21
21 -
 22
22 -
 23
23 -
 24
24 -
 25
25 -
 26
26 -
 27
27 -
 28
28 -
 29
29 -
 30
30 -
 31
31 -
 32
32 -
 33
33 -
 34
34 -
 35
35 -
 36
36 -
 37
37 -
38
-
39
-
40
-
41
-
42
-
43
-
44
-
45
-
46
-
47
-
48
-
49
-
50
-
51
-
52
-
53
-
54
-
55
-
56
-
57
-
58
-
59
-
60
-
61
-
62
-
63
-
64
-
65
-
66
-
67
-
68
-
69
-
70
-
71
-
72
-
73
-
74
-
75
-
76
-
77
-
78
-
79
-
80
-
81
-
82
-
83
-
84
-
85
-
86
-
87
-
88
-
89
-
90
-
91
-
92
 |
 |

CVS CAREMARK 2012 ANNUAL REPORT
25
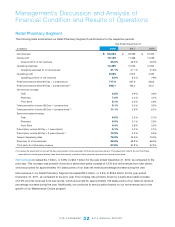
• During2012,grossprotinourPharmacyServicesSegmentandRetailPharmacySegmentincreasedby16.1%and
9.4%,respectively,comparedtotheprioryear.FortheyearendedDecember31,2012,grossprotasapercentofnet
revenuesinourPharmacyServicesSegmentandRetailPharmacySegmentwas5.2%and30.0%,respectively.
• During2011,grossprotinourRetailPharmacySegmentincreasedby2.5%whichwaspartiallyoffsetbydeclinesin
ourPharmacyServicesSegmentof1.1%,comparedtotheprioryear.FortheyearendedDecember31,2011,gross
protasapercentofnetrevenuesinourPharmacyServicesSegmentandRetailPharmacySegmentwas5.6%and
29.3%,respectively.
• TheincreasedweightingtowardthePharmacyServicesSegment,whichhasalowergrossmarginthantheRetailPharmacy
Segment, is resulting in a continued decline in consolidated gross profit as a percent of net revenues. In addition, gross
profit has been negatively impacted by the efforts of managed care organizations, pharmacy benefit managers and
governmental and other third-party payors to reduce their prescription drug costs.
• Inaddition,forthethreeyears2010through2012,ourgrossprotcontinuedtobenetfromtheincreasedutilizationof
generic drugs (which normally yield a higher gross profit rate than equivalent brand name drugs) in both the Pharmacy
Services and Retail Pharmacy Segments.
Please see the Segment Analysis later in this document for additional information about our gross profit.
Operating expenses
increased$1.0billion,or7.4%intheyearendedDecember31,2012,ascomparedtotheprior
year.Operatingexpensesasapercentofnetrevenuesimprovedapproximately90basispointsto12.4%intheyear
ended December 31, 2012. The increase in operating expenses in the year ended December 31, 2012 was primarily due
to incremental store operating costs associated with a higher store count as compared to the prior year period, as well as
the expansion of our Medicare Part D business. The improvement in operating expenses as a percent of net revenues is
primarily due to expense leverage from net revenue growth and expense control initiatives.
Operating expenses increased $149 million in the year ended December 31, 2011 as compared to the prior year.
Operatingexpensesasapercentofnetrevenuesincreasedapproximately140basispointsto13.3%intheyearended
December 31, 2011. The increase in operating expenses in the year ended December 31, 2011 was primarily due to
incremental store operating costs associated with a higher store count as compared to the prior year period, as well as
costs associated with changes designed to streamline our Pharmacy Services Segment and expenses associated with
the acquisition and integration of the Medicare prescription drug business of Universal Medicare Corp. (the “UAM
Medicare Part D Business”).
Please see the Segment Analysis later in this document for additional information about operating expenses.
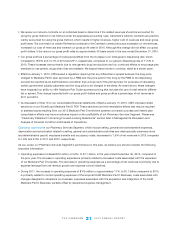
Interest expense, net
consisted of the following:
In millions 2012 2011 2010
Interest expense $ 561 $ 588 $ 539
Interest income (4) (4) (3)
Interest expense, net $ 557 $ 584 $ 536
Net interest expense decreased $27 million during the year ended December 31, 2012, which resulted from a reduction in
our average outstanding short-term and long-term debt. During 2011, net interest expense increased by $48 million, to
$584 million compared to 2010, due to a higher average interest rate during the period as we shifted from short-term debt
to long-term debt.