CVS 2009 Annual Report Download - page 75
Download and view the complete annual report
Please find page 75 of the 2009 CVS annual report below. You can navigate through the pages in the report by either clicking on the pages listed below, or by using the keyword search tool below to find specific information within the annual report.-
 1
1 -
2
-
3
-
4
-
5
-
6
-
7
-
8
-
9
-
10
-
11
-
12
-
13
-
14
-
15
-
16
-
17
-
18
-
19
-
20
-
21
-
22
-
23
-
24
-
25
-
26
-
27
-
28
-
29
-
30
-
31
-
32
-
33
-
34
-
35
-
36
-
37
-
38
-
39
-
40
-
41
-
42
-
43
-
44
-
45
-
46
-
47
-
48
-
49
-
50
-
51
-
52
-
53
-
54
-
55
-
56
-
57
-
58
-
59
-
60
-
61
-
62
-
63
-
64
-
 65
65 -
 66
66 -
 67
67 -
 68
68 -
 69
69 -
 70
70 -
 71
71 -
 72
72 -
 73
73 -
 74
74 -
 75
75 -
 76
76 -
 77
77 -
 78
78 -
 79
79 -
 80
80
 |
 |

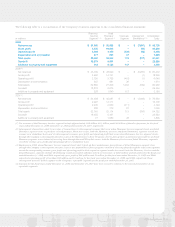
Note 15 Quarterly Financial Information (Unaudited)
First Second Third Fourth
in millions, except per share amounts Quarter Quarter Quarter Quarter Fiscal Year
2009:
Net revenues $ 23,394 $ 24,871 $ 24,642 $ 25,822 $ 98,729
Gross profit 4,748 5,052 5,012 5,568 20,380
Operating profit 1,377 1,600 1,566 1,895 6,438
Income from continuing operations 743 889 1,023 1,053 3,708
Loss from discontinued operations, net of income tax benefit (5) (3) (2) (2) (12)
Net income 738 886 1,021 1,051 3,696
Earnings per share from continuing operations, basic $ 0.51 $ 0.61 $ 0.72 $ 0.75 $ 2.59
Loss per common share from discontinued operations – – (0.01) – (0.01)
Net earnings per common share, basic $ 0.51 $ 0.61 $ 0.71 $ 0.75 $ 2.58
Earnings per common share from continuing operations, diluted $ 0.51 $ 0.60 $ 0.71 $ 0.74 $ 2.56
Loss per common share from discontinued operations (0.01) – – – (0.01)
Net earnings per common share, diluted $ 0.50 $ 0.60 $ 0.71 $ 0.74 $ 2.55
Dividends per common share $ 0.07625 $ 0.07625 $ 0.07625 $ 0.07625 $ 0.30500
Stock price: (New York Stock Exchange)
High $ 30.47 $ 34.22 $ 37.75 $ 38.27 $ 38.27
Low $ 23.74 $ 27.08 $ 30.58 $ 27.38 $ 23.74
2008 (1):
Net revenues $ 21,326 $ 21,140 $ 20,863 $ 24,143 $ 87,472
Gross profit 4,293 4,373 4,401 5,223 18,290
Operating profit 1,370 1,478 1,466 1,732 6,046
Income from continuing operations 749 824 819 952 3,344
Loss from discontinued operations, net of income tax benefit – (49) (83) – (132)
Net income 749 775 736 952 3,212
Earnings per share from continuing operations, basic $ 0.52 $ 0.57 $ 0.57 $ 0.66 $ 2.32
Loss per common share from discontinued operations – (0.03) (0.06) – (0.09)
Net earnings per common share, basic $ 0.52 $ 0.54 $ 0.51 $ 0.66 $ 2.23
Earnings per common share from continuing operations, diluted $ 0.51 $ 0.56 $ 0.56 $ 0.65 $ 2.27
Loss per common share from discontinued operations – (0.03) (0.06) – (0.09)
Net earnings per common share, diluted $ 0.51 $ 0.53 $ 0.50 $ 0.65 $ 2.18
Dividends per common share $ 0.06000 $ 0.06000 $ 0.06900 $ 0.06900 $ 0.25800
Stock price: (New York Stock Exchange)
High $ 41.53 $ 44.29 $ 40.14 $ 34.90 $ 44.29
Low $ 34.91 $ 39.02 $ 31.81 $ 23.19 $ 23.19
(1) On December 23, 2008, our Board of Directors approved a change in our fiscal year-end from the Saturday nearest December 31 of each year
to December 31 of each year to better reflect our position in the health care, rather than the retail, industry. The fiscal year change was effective
beginning with the fourth of fiscal 2008.
2009 Annual Report 71