CVS 2009 Annual Report Download - page 37
Download and view the complete annual report
Please find page 37 of the 2009 CVS annual report below. You can navigate through the pages in the report by either clicking on the pages listed below, or by using the keyword search tool below to find specific information within the annual report.-
 1
1 -
2
-
3
-
4
-
5
-
6
-
7
-
8
-
9
-
10
-
11
-
12
-
13
-
14
-
15
-
16
-
17
-
18
-
19
-
20
-
21
-
22
-
23
-
24
-
25
-
26
-
 27
27 -
 28
28 -
 29
29 -
 30
30 -
 31
31 -
 32
32 -
 33
33 -
 34
34 -
 35
35 -
 36
36 -
 37
37 -
 38
38 -
 39
39 -
 40
40 -
 41
41 -
 42
42 -
 43
43 -
 44
44 -
 45
45 -
 46
46 -
 47
47 -
48
-
49
-
50
-
51
-
52
-
53
-
54
-
55
-
56
-
57
-
58
-
59
-
60
-
61
-
62
-
63
-
64
-
65
-
66
-
67
-
68
-
69
-
70
-
71
-
72
-
73
-
74
-
75
-
76
-
77
-
78
-
79
-
80
 |
 |

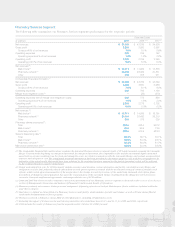
2009 includes a full year of net cash provided by operating
activities from the Longs Acquisition compared to 2008. The
increase in net cash provided by operating activities during
2009 was primarily due to increased net income, offset by
an increase in inventory purchases primarily associated with
pharmacy pre-buy opportunities and our increased store
count. 2008 includes a full year of net cash provided by
operating activities from Caremark, compared to 2007, which
includes Caremark from the merger date (March 22, 2007)
forward. 2008 also includes net cash provided by operating
activities from the Longs Acquisition from the acquisition date
(October 20, 2008) forward.
Net cash used in investing activities decreased to approxi-
mately $1.1 billion in 2009. This compares to approximately
$4.6 billion and $3.1 billion in 2008 and 2007, respectively. The
decrease in net cash used in investing activities was primarily
due to a reduction in acquisition activities in 2009 and an increase
in sale-leaseback transactions. The increase in net cash used in
investing activities during 2008 was primarily due to the Longs
Acquisition. The $3.1 billion of net cash used in investing
activities during 2007 was primarily due to the Caremark Merger.
Gross capital expenditures totaled approximately $2.5 billion
during 2009, compared to approximately $2.2 billion in 2008
and $1.8 billion 2007. The increase in gross capital expendi-
tures during 2009 was primarily due to resets related to stores
acquired as part of the Longs Acquisition.
Proceeds from sale-leaseback transactions totaled approxi-
mately $1.6 billion in 2009. This compares to $204 million
in 2008 and $601 million in 2007. Under the sale-leaseback
transactions, the properties are sold at fair value, which
approximates net book value, and the resulting leases qualify
and are accounted for as operating leases. The specific timing
and amount of future sale-leaseback transactions will vary
depending on future market conditions and other factors. The
significant increase in 2009 was primarily due to the deferral of
transactions in 2008 due to market conditions at that time.
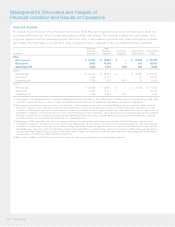
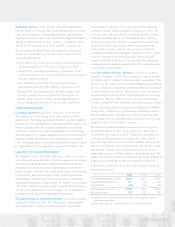
Following is a summary of our store development activity for
the respective years:
2009 2008 2007
Total stores (beginning of year) 6,981 6,301 6,205
New and acquired stores
(1) 175 719 140
Closed stores (82) (39) (44)
Total stores (end of year) 7,074 6,981 6,301
Relocated stores
(2) 110 129 137
(1) 2008 includes 529 Longs Drug Stores that were acquired as part of
the Longs Acquisition.
(2) Relocated stores are not included in new or closed store totals.
Operating expenses, which include store and administrative
payroll, employee benefits, store and administrative occupancy
costs, selling expenses, advertising expenses, administrative
expenses and depreciation and amortization expense increased
slightly to 22.5% of net revenues in 2009, compared to 22.4%
and 22.5% of net revenues in 2008 and 2007, respectively.
As you review our Retail Pharmacy segment’s performance
in this area, we believe you should consider the following
important information:
• Three fewer days in the 2009 fiscal year positively impacted
operating expenses by $92 million, compared to 2008.
• During 2009, operating expenses as a percentage of net
revenues increased as a result of integration costs associated
with the Longs Acquisition.
• Four additional days in the 2008 fiscal year increased
operating expenses by $135 million, compared to 2007.
• During 2008, operating expenses as a percentage of net
revenues continued to be impacted by an increase in
generic drug revenues. Generic drugs typically have a
lower selling price than their brand named equivalents.
Corporate Segment
Operating expenses increased $78 million, or 16.9% and
$50 million, or 12.2% during fiscal 2009 and fiscal 2008,
respectively. Operating expenses within the Corporate segment
include executive management, corporate relations, legal, com-
pliance, human resources, corporate information technology
and finance related costs. Operating expenses increased during
2009 primarily due to higher legal fees associated with increased
litigation activity, depreciation and compensation and benefit
costs. Operating expenses increased during 2008 primarily related
to depreciation and compensation and benefit related costs.
Liquidity and Capital Resources
We maintain a level of liquidity sufficient to allow us to cover
our cash needs in the short-term. Over the long-term, we manage
our cash and capital structure to maximize shareholder return,
strengthen our financial position and maintain flexibility for
future strategic initiatives. We continuously assess our working
capital needs, debt and leverage levels, capital expenditure
requirements, dividend payouts, potential share repurchases
and future investments or acquisitions. We believe our operating
cash flows, commercial paper program, sale-leaseback program,
as well as any potential future borrowings, will be sufficient to
fund these future payments and long-term initiatives.
Net cash provided by operating activities increased to approx-
imately $4.0 billion in 2009. This compares to approximately
$3.9 billion and $3.2 billion in 2008 and 2007, respectively.
2009 Annual Report 33