CVS 2009 Annual Report Download - page 4
Download and view the complete annual report
Please find page 4 of the 2009 CVS annual report below. You can navigate through the pages in the report by either clicking on the pages listed below, or by using the keyword search tool below to find specific information within the annual report.-
 1
1 -
 2
2 -
 3
3 -
 4
4 -
 5
5 -
 6
6 -
 7
7 -
 8
8 -
 9
9 -
 10
10 -
 11
11 -
 12
12 -
 13
13 -
 14
14 -
 15
15 -
16
-
17
-
18
-
19
-
20
-
21
-
22
-
23
-
24
-
25
-
26
-
27
-
28
-
29
-
30
-
31
-
32
-
33
-
34
-
35
-
36
-
37
-
38
-
39
-
40
-
41
-
42
-
43
-
44
-
45
-
46
-
47
-
48
-
49
-
50
-
51
-
52
-
53
-
54
-
55
-
56
-
57
-
58
-
59
-
60
-
61
-
62
-
63
-
64
-
65
-
66
-
67
-
68
-
69
-
70
-
71
-
72
-
73
-
74
-
75
-
76
-
77
-
78
-
79
-
80
 |
 |
FISCAL YEAR FISCAL YEAR
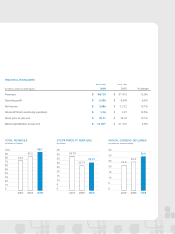
(in millions, except per share figures) 2009 2008 % change
Revenues $ 98,729 $ 87,472 12.9%
Operating profit $ 6,438 $ 6,046 6.5%
Net income $ 3,696 $ 3,212 15.1%
Diluted EPS from continuing operations $ 2.56 $ 2.27 12.5%
Stock price at year-end $ 32.21 $ 28.74 12.1%
Market capitalization at year-end $ 44,841 $ 41,301 8.6%
FINANCIAL HIGHLIGHTS
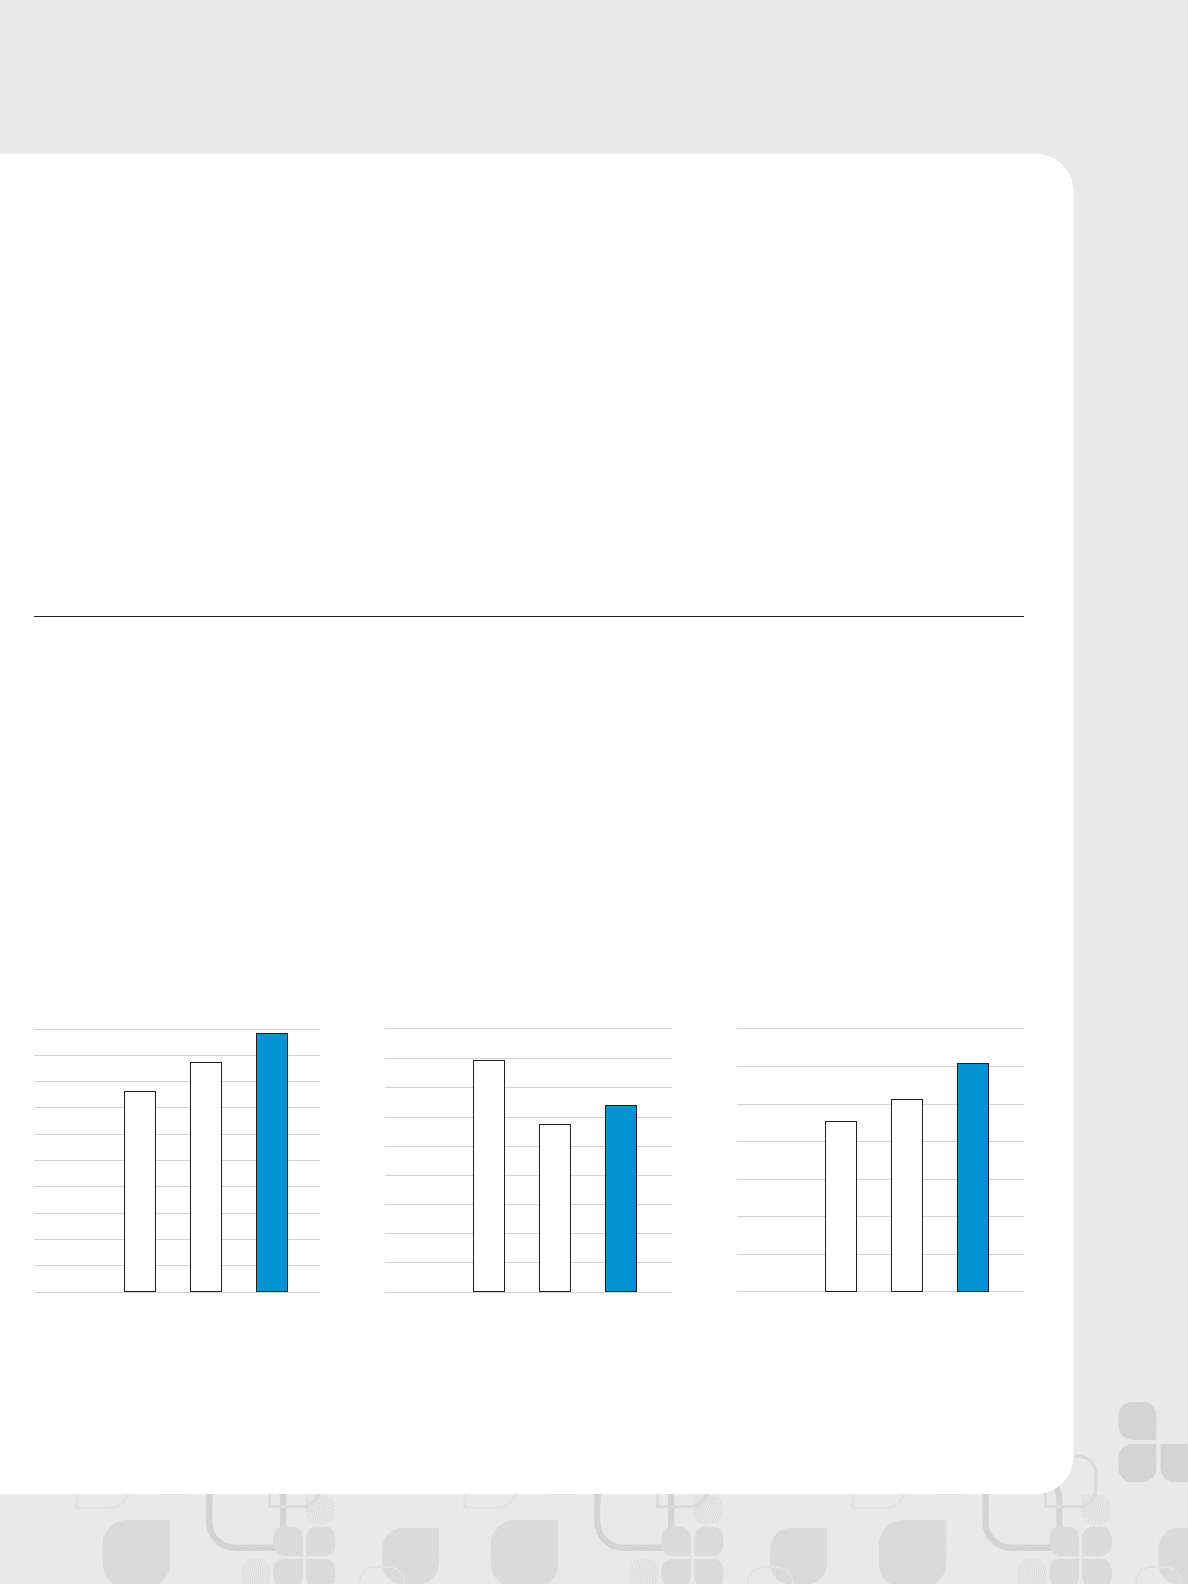
TOTAL REVENUES
(in billions of dollars)
100
90
80
70
60
50
40
30
20
10
0
200920082007
76.3
87.5
98.7
STOCK PRICE AT YEAR-END
(in dollars)
45
40
35
30
25
20
15
10
5
0
200920082007
39.75
28.74
32.21
ANNUAL DIVIDEND DECLARED
(in cents per common share)
35
30
25
20
15
10
5
0
200920082007
25.8
22.9
30.5