CVS 2009 Annual Report Download - page 29
Download and view the complete annual report
Please find page 29 of the 2009 CVS annual report below. You can navigate through the pages in the report by either clicking on the pages listed below, or by using the keyword search tool below to find specific information within the annual report.-
 1
1 -
2
-
3
-
4
-
5
-
6
-
7
-
8
-
9
-
10
-
11
-
12
-
13
-
14
-
15
-
16
-
17
-
18
-
 19
19 -
 20
20 -
 21
21 -
 22
22 -
 23
23 -
 24
24 -
 25
25 -
 26
26 -
 27
27 -
 28
28 -
 29
29 -
 30
30 -
 31
31 -
 32
32 -
 33
33 -
 34
34 -
 35
35 -
 36
36 -
 37
37 -
 38
38 -
 39
39 -
40
-
41
-
42
-
43
-
44
-
45
-
46
-
47
-
48
-
49
-
50
-
51
-
52
-
53
-
54
-
55
-
56
-
57
-
58
-
59
-
60
-
61
-
62
-
63
-
64
-
65
-
66
-
67
-
68
-
69
-
70
-
71
-
72
-
73
-
74
-
75
-
76
-
77
-
78
-
79
-
80
 |
 |

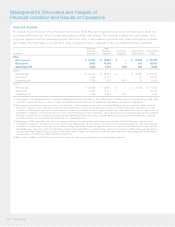
Income tax provision. Our effective income tax rate was
37.3% in 2009, 39.6% in 2008 and 39.5% in 2007.
During 2009, the decrease in the effective income tax rate
was due to the recognition of approximately $167 million
of previously unrecognized tax benefits (including accrued
interest) relating to the expiration of various statutes of
limitation and settlements with tax authorities. Excluding
the impact of the recognition of previously unrecognized
tax benefits for 2009, the effective income tax rate for 2009
would have been approximately 40.1%.
Income from continuing operations increased $364 million or
10.9% to $3.7 billion (or $2.56 per diluted share) in 2009. This
compares to $3.3 billion (or $2.27 per diluted share) in 2008
and $2.6 billion (or $1.92 per diluted share) in 2007.
Loss from discontinued operations. In connection with
certain business dispositions completed between 1991
and 1997, the Company continues to guarantee store lease
obligations for a number of former subsidiaries, including
Linens ’n Things. On May 2, 2008, Linens Holding Co.
and certain affiliates, which operate Linens ’n Things, filed
voluntary petitions under Chapter 11 of the United States
Bankruptcy Code in the United States Bankruptcy Court for
the District of Delaware. The Company’s loss from discontin-
ued operations includes $12 million ($19 million, net of a
$7 million income tax benefit) and $132 million ($214 million,
net of an $82 million income tax benefit) of lease-related
costs for 2009 and 2008, respectively.
Net income increased $484 million or 15.1% to $3.7 billion (or
$2.55 per diluted share) in 2009. This compares to $3.2 billion
(or $2.18 per diluted share) in 2008 and $2.6 billion (or $1.92
per diluted share) in 2007. Net income for 2009 benefited from
the $167 million income tax benefit described above.
Operating expenses increased $1.7 billion and $930 million
during 2009 and 2008, respectively. As you review our
performance in this area, we believe you should consider
the following important information:
• During 2009, the Longs Acquisition increased operating
expenses by $1.0 billion, but positively impacted our
operating expense rate as a percentage of net revenues
compared to 2008.
• Three fewer days in the 2009 fiscal year, positively impacted
operating expenses by $97 million, compared to 2008.
• During 2008, the Caremark Merger increased operating
expenses by approximately $92 million, compared to 2007.
2008 includes a full year of operating expenses from
Caremark, compared to 2007, which includes operating
expenses from Caremark from the merger date (March 22,
2007) forward.
• During 2008, the Longs Acquisition increased operating
expenses by $260 million, compared to 2007. 2008 includes
operating expenses from the Longs Drug Stores and RxAmer-
ica from the acquisition date (October 20, 2008) forward.
• Four additional days in the 2008 fiscal year increased
operating expenses by $146 million, compared to 2007.
Please see the Segment Analysis later in this document for
additional information about operating expenses.
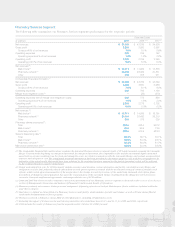
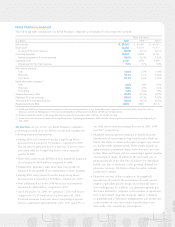
Interest expense, net consisted of the following:
in millions 2009 2008 2007
Interest expense $ 530 $ 530 $ 468
Interest income (5) (21) (33)
Interest expense, net $ 525 $ 509 $ 435
During 2009, net interest expense increased by $16 million,
compared to 2008, due primarily to lower interest income
associated with our temporary investments.
During 2008, net interest expense increased by $74 million,
compared to 2007, due to a combination of higher interest
rates and an increase in our average debt balance, which
resulted primarily from the borrowings used to fund an acceler-
ated share repurchase program and the Longs Acquisition.
2009 Annual Report 25