CVS 2009 Annual Report Download - page 33
Download and view the complete annual report
Please find page 33 of the 2009 CVS annual report below. You can navigate through the pages in the report by either clicking on the pages listed below, or by using the keyword search tool below to find specific information within the annual report.-
 1
1 -
2
-
3
-
4
-
5
-
6
-
7
-
8
-
9
-
10
-
11
-
12
-
13
-
14
-
15
-
16
-
17
-
18
-
19
-
20
-
21
-
22
-
 23
23 -
 24
24 -
 25
25 -
 26
26 -
 27
27 -
 28
28 -
 29
29 -
 30
30 -
 31
31 -
 32
32 -
 33
33 -
 34
34 -
 35
35 -
 36
36 -
 37
37 -
 38
38 -
 39
39 -
 40
40 -
 41
41 -
 42
42 -
 43
43 -
44
-
45
-
46
-
47
-
48
-
49
-
50
-
51
-
52
-
53
-
54
-
55
-
56
-
57
-
58
-
59
-
60
-
61
-
62
-
63
-
64
-
65
-
66
-
67
-
68
-
69
-
70
-
71
-
72
-
73
-
74
-
75
-
76
-
77
-
78
-
79
-
80
 |
 |

Part D Prescription Drug Plan (a “PDP”). We are also a
national provider of drug benefits to eligible beneficiaries
under the Medicare Part D program through our subsidiaries,
SilverScript and Accendo (which have been approved by
CMS as PDPs), and in 2008 and 2007, through a joint venture
with Universal American Corp. (“UAC”), which sponsored a
CMS approved PDP. The Company and UAC dissolved this
joint venture at the end of 2008 and divided the responsibility
for providing Medicare Part D services to the affected plan
members beginning with the 2009 plan year. In addition,
we assist employer, union and other health plan clients that
qualify for the retiree drug subsidy under Medicare Part D
by collecting eligibility data from and submitting drug cost
data to CMS in order for them to obtain the subsidy.
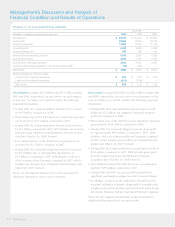
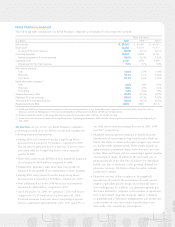
Gross profit includes net revenues less cost of revenues. Cost
of revenues includes (i) the cost of pharmaceuticals dispensed,
either directly through our mail service and specialty retail
pharmacies or indirectly through our national retail pharmacy
network, (ii) shipping and handling costs and (iii) the operating
costs of our mail service pharmacies, customer service opera-
tions and related information technology support. Gross profit
as a percentage of revenues was 7.5%, 8.1% and 8.6% in 2009,
2008 and 2007, respectively.
As you review our Pharmacy Services segment’s performance
in this area, we believe you should consider the following
important information:
• Three fewer days in the 2009 fiscal year negatively impacted
gross profit by $23 million, compared to 2008.
• Four additional days in the 2008 fiscal year increased gross
profit by $49 million, compared to 2007.
• Our gross profit dollars and gross profit rates continued
to be impacted by our efforts to (i) retain existing clients,
(ii) obtain new business and (iii) maintain or improve
the purchase discounts we received from manufacturers,
wholesalers and retail pharmacies. In particular, competitive
pressures in the PBM industry have caused us and other
PBM’s to share a larger portion of rebates and/or discounts
received from pharmaceutical manufacturers. During the
2008 selling season, the Company renewed a number of
existing clients and obtained new clients at lower rates,
which resulted in gross profit compression during 2009.
• As discussed previously in this document, we review
our national retail network contracts on an individual basis
to determine if the related revenues should be accounted
for using the gross method or net method under the
The increase in 2008 was primarily due to the addition of
approximately 13.5 million RxAmerica claims (beginning
October 20, 2008), growth in our existing business (including
our Medicare Part D business), the four additional days in
the 2008 reporting period compared to the 2007 reporting
period and new clients.
• During 2009, our average revenue per pharmacy network
claim processed increased by 15.4%, compared to 2008. Our
average revenue per pharmacy network claim processed
is affected by (i) the inclusion of RxAmerica results, whose
retail pharmacy network contracts were accounted for using
the net revenue recognition method prior to April 1, 2009,
as discussed above; (ii) higher drug costs, which normally
result in higher claim revenues, (iii) client pricing, (iv)
changes in the percentage of generic drugs dispensed and
(v) claims mix.
• During 2008, our comparable average revenue per pharmacy
network claim processed increased by 1.2%, compared to
2007. This increase was primarily due to the change in the
revenue recognition method from net to gross for certain
PharmaCare contracts (as discussed previously) and higher
drug costs. These factors increased our average revenue per
retail network claim by approximately 6.6%. These increases
were offset, in part by (i) the inclusion of RxAmerica’s
results (beginning October 20, 2008), which decreased our
average revenue per retail network claim by 2.1%, (ii) client
pricing, (iii) claims mix and (iv) an increase in the percentage
of generic drugs dispensed.
• During 2009 and 2008, our pharmacy network generic
dispensing rate increased to 69.3% and 66.2%, respectively,
compared to our comparable pharmacy network dispensing
rate of 61.7% in 2007. These increases were primarily due to
the impact of new generic drug introductions, our continued
efforts to encourage plan members to use generic drugs
when they are available and the impact of RxAmerica claims.
RxAmerica pharmacy network claims increased our generic
dispensing rate by approximately 120 basis points in 2009
compared to 20 basis points in 2008. We believe our generic
dispensing rates will continue to increase in future periods.
This increase will be affected by, among other things, the
number of new generic drug introductions and our success
at encouraging plan members to utilize generic drugs when
they are available.
• During 2009 and 2008, our net revenues benefited from our
participation in the administration of the Medicare Part D
drug benefit by providing PBM services to our health plan
clients and other clients that have qualified as a Medicare
2009 Annual Report 29