CVS 2009 Annual Report Download - page 31
Download and view the complete annual report
Please find page 31 of the 2009 CVS annual report below. You can navigate through the pages in the report by either clicking on the pages listed below, or by using the keyword search tool below to find specific information within the annual report.-
 1
1 -
2
-
3
-
4
-
5
-
6
-
7
-
8
-
9
-
10
-
11
-
12
-
13
-
14
-
15
-
16
-
17
-
18
-
19
-
20
-
 21
21 -
 22
22 -
 23
23 -
 24
24 -
 25
25 -
 26
26 -
 27
27 -
 28
28 -
 29
29 -
 30
30 -
 31
31 -
 32
32 -
 33
33 -
 34
34 -
 35
35 -
 36
36 -
 37
37 -
 38
38 -
 39
39 -
 40
40 -
 41
41 -
42
-
43
-
44
-
45
-
46
-
47
-
48
-
49
-
50
-
51
-
52
-
53
-
54
-
55
-
56
-
57
-
58
-
59
-
60
-
61
-
62
-
63
-
64
-
65
-
66
-
67
-
68
-
69
-
70
-
71
-
72
-
73
-
74
-
75
-
76
-
77
-
78
-
79
-
80
 |
 |

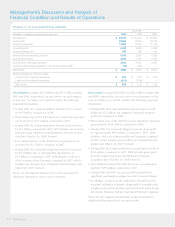
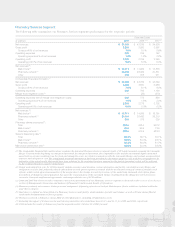
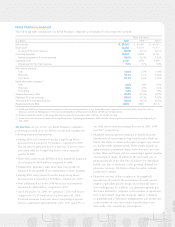
Pharmacy Services Segment
The following table summarizes our Pharmacy Services segment’s performance for the respective periods:
Fiscal Year Ended
in millions 2009 2008 (3) (8) 2007 (3)
Net revenues $ 51,065 $ 43,769 $ 34,938
Gross profit 3,835 3,550 2,997
Gross profit % of net revenues 7.5% 8.1% 8.6%
Operating expenses 969 795 752
Operating expenses % of net revenues 1.9% 1.8% 2.2%
Operating profit 2,866 2,755 2,245
Operating profit % of net revenues 5.6% 6.3% 6.4%
Net revenues (4):
Mail choice (5) $ 16,711 $ 14,909 $ 13,836
Pharmacy network (6) 34,004 28,482 20,831
Other 350 378 271
Comparable Financial Information (1)
Net revenues $ 51,065 $ 43,769 $ 43,349
Gross profit 3,835 3,550 3,558
Gross profit % of net revenues 7.5% 8.1% 8.2%
Operating expenses 969 795 1,129
Merger and integration costs (2) – (23) (273)
Operating expenses (net of merger and integration costs) 969 772 856
Operating expenses % of net revenues 1.9% 1.8% 2.0%
Operating profit 2,866 2,778 2,702
Operating profit % of net revenues 5.6% 6.3% 6.2%
Net revenues (4):
Mail choice (5) $ 16,711 $ 14,909 $ 16,791
Pharmacy network (5) 34,004 28,482 26,219
Other 350 378 339
Pharmacy claims processed (4):
Total 658.5 633.4 607.2
Mail choice (5) 66.0 60.9 73.9
Pharmacy network (5) 592.5 572.5 533.3
Generic dispensing rate (4):
Total 68.2% 65.1% 60.1%
Mail choice (5) 56.5% 54.4% 48.1%
Pharmacy network (6) 69.3% 66.2% 61.7%
Mail choice penetration rate (7) 23.8% 22.9% 28.2%
(1) The Comparable Financial Information above combines the historical Pharmacy Services segment results of CVS and Caremark assuming the Caremark
Merger occurred at the beginning of each period presented. In each period presented, the comparable results include incremental depreciation and
amortization expense resulting from the fixed and intangible assets recorded in connection with the Caremark Merger and exclude merger-related
expenses and integration costs. The comparable financial information has been provided for illustrative purposes only and does not purport to be
indicative of the actual results that would have been achieved by the combined business segment for the periods presented or that will be achieved
by the combined business segment in the future.
(2) Merger and integration costs for 2008 primarily include severance and retention, system integration and facility consolidation costs. Merger and
integration costs for 2007 primarily include $80 million of stock option expense associated with the accelerated vesting of certain Caremark stock
options, which vested upon consummation of the merger due to the change in control provisions of the underlying Caremark stock option plans,
$43 million of change-in-control payments due upon the consummation of the Caremark Merger, resulting from the change-in-control provisions
in certain Caremark employment agreements, and merger-related costs of $150 million.
(3) 2008 and 2007 have been revised to conform to the current presentation of our Pharmacy Services segment as discussed in the
Overview of Our Business
section of Management’s Discussion and Analysis of Financial Condition and Results of Operations.
(4) Pharmacy network net revenues, claims processed and generic dispensing rates do not include Maintenance Choice, which are included within the
mail choice category.
(5) Mail choice is defined as claims filled at a Pharmacy Services’ mail facility, which includes specialty mail claims, as well as 90-day claims filled at
retail under the Maintenance Choice program.
(6) Pharmacy network is defined as claims filled at retail pharmacies, including CVS/pharmacy stores.
(7) Excluding the impact of RxAmerica, the mail choice penetration rate would have been 26.2% and 23.3% for 2009 and 2008, respectively.
(8) 2008 includes the results of RxAmerica from the acquisition date (October 20, 2008) forward.
2009 Annual Report 27