CVS 2009 Annual Report Download - page 28
Download and view the complete annual report
Please find page 28 of the 2009 CVS annual report below. You can navigate through the pages in the report by either clicking on the pages listed below, or by using the keyword search tool below to find specific information within the annual report.-
 1
1 -
2
-
3
-
4
-
5
-
6
-
7
-
8
-
9
-
10
-
11
-
12
-
13
-
14
-
15
-
16
-
17
-
 18
18 -
 19
19 -
 20
20 -
 21
21 -
 22
22 -
 23
23 -
 24
24 -
 25
25 -
 26
26 -
 27
27 -
 28
28 -
 29
29 -
 30
30 -
 31
31 -
 32
32 -
 33
33 -
 34
34 -
 35
35 -
 36
36 -
 37
37 -
 38
38 -
39
-
40
-
41
-
42
-
43
-
44
-
45
-
46
-
47
-
48
-
49
-
50
-
51
-
52
-
53
-
54
-
55
-
56
-
57
-
58
-
59
-
60
-
61
-
62
-
63
-
64
-
65
-
66
-
67
-
68
-
69
-
70
-
71
-
72
-
73
-
74
-
75
-
76
-
77
-
78
-
79
-
80
 |
 |

Management’s Discussion and Analysis of
Financial Condition and Results of Operations
Net revenues increased $11.3 billion and $11.1 billion during
2009 and 2008, respectively. As you review our performance
in this area, we believe you should consider the following
important information:
• During 2009, the Longs Acquisition increased net revenues
by $6.6 billion, compared to 2008.
• Three fewer days in the 2009 fiscal year negatively impacted
net revenues by $671 million, compared to 2008.
• During 2008, the Longs Acquisition increased net revenues
by $1.1 billion, compared to 2007. 2008 includes net revenues
from the Longs Drug Stores and RxAmerica from the acquisi-
tion date (October 20, 2008) forward.
• Four additional days in the 2008 fiscal year increased net
revenues by $1.1 billion, compared to 2007.
• During 2008, the Caremark Merger increased net revenues
by $6.9 billion (net of intersegment eliminations of
$1.0 billion), compared to 2007. 2008 includes a full year
of net revenues from Caremark, compared to 2007, which
includes net revenues from Caremark from the merger date
(March 22, 2007) forward.
Please see the Segment Analysis later in this document for
additional information about our net revenues.
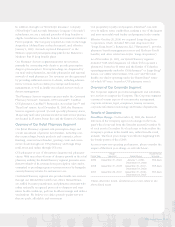
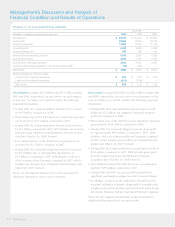
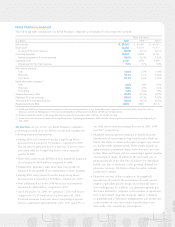
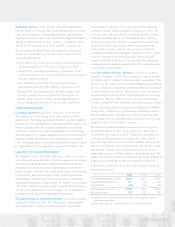
Summary of our Consolidated Financial Results
Fiscal Year
in millions, except per common share amounts 2009 2008 2007
Net revenues $ 98,729 $ 87,472 $ 76,330
Gross profit 20,380 18,290 16,108
Operating expenses 13,942 12,244 11,314
Operating profit 6,438 6,046 4,794
Interest expense, net 525 509 435
Income before income tax provision 5,913 5,537 4,359
Income tax provision 2,205 2,193 1,722
Income from continuing operations 3,708 3,344 2,637
Loss from discontinued operations, net of income tax benefit (12) (132) –
Net income $ 3,696 $ 3,212 $ 2,637
Diluted earnings per common share:
Income from continuing operations $ 2.56 $ 2.27 $ 1.92
Loss from discontinued operations (0.01) (0.09) –
Net income $ 2.55 $ 2.18 $ 1.92
Gross profit increased $2.1 billion and $2.2 billion during 2009
and 2008, respectively. As you review our performance in this
area, we believe you should consider the following important
information:
• During 2009, the Longs Acquisition increased gross profit
dollars by $1.1 billion, but negatively impacted our gross
profit rate compared to 2008.
• Three fewer days in the 2009 fiscal year, negatively impacted
gross profit by $146 million, compared to 2008.
• During 2008, the Caremark Merger increased gross profit
by approximately $553 million, compared to 2007. 2008
includes a full year of gross profit from Caremark, compared
to 2007, which includes gross profit from Caremark from the
merger date (March 22, 2007) forward.
• During 2008, the Longs Acquisition increased gross profit by
$314 million, compared to 2007. 2008 includes gross profit
from the Longs Drug Stores and RxAmerica from the
acquisition date (October 20, 2008) forward.
• Four additional days in the 2008 fiscal year increased gross
profit by $238 million, compared to 2007.
• During 2008 and 2007, our gross profit benefited from
significant purchasing synergies from the Caremark Merger.
• In addition, our gross profit continued to benefit from the
increased utilization of generic drugs (which normally yield
a higher gross profit rate than equivalent brand name drugs)
in both the Pharmacy Services and Retail Pharmacy segments.
Please see the Segment Analysis later in this document for
additional information about our gross profit.
CVS Caremark
24