CVS 2009 Annual Report Download - page 50
Download and view the complete annual report
Please find page 50 of the 2009 CVS annual report below. You can navigate through the pages in the report by either clicking on the pages listed below, or by using the keyword search tool below to find specific information within the annual report.-
 1
1 -
2
-
3
-
4
-
5
-
6
-
7
-
8
-
9
-
10
-
11
-
12
-
13
-
14
-
15
-
16
-
17
-
18
-
19
-
20
-
21
-
22
-
23
-
24
-
25
-
26
-
27
-
28
-
29
-
30
-
31
-
32
-
33
-
34
-
35
-
36
-
37
-
38
-
39
-
 40
40 -
 41
41 -
 42
42 -
 43
43 -
 44
44 -
 45
45 -
 46
46 -
 47
47 -
 48
48 -
 49
49 -
 50
50 -
 51
51 -
 52
52 -
 53
53 -
 54
54 -
 55
55 -
 56
56 -
 57
57 -
 58
58 -
 59
59 -
 60
60 -
61
-
62
-
63
-
64
-
65
-
66
-
67
-
68
-
69
-
70
-
71
-
72
-
73
-
74
-
75
-
76
-
77
-
78
-
79
-
80
 |
 |

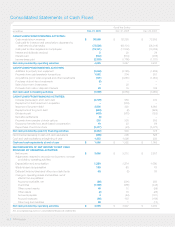
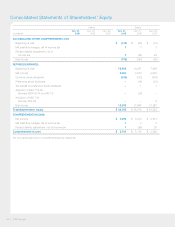
Consolidated Statements of Cash Flows
Fiscal Year Ended
in millions Dec. 31, 2009 Dec. 31, 2008 Dec. 29, 2007
CASH FLOWS FROM OPERATING ACTIVITIES:
Cash receipts from revenues $ 93,568 $ 82,250 $ 72,533
Cash paid for inventory and prescriptions dispensed by
retail network pharmacies (73,536) (64,131) (56,319)
Cash paid to other suppliers and employees (13,121) (11,832) (10,769)
Interest and dividends received 5 20 34
Interest paid (542) (574) (468)
Income taxes paid (2,339) (1,786) (1,781)
Net cash provided by operating activities 4,035 3,947 3,230
CASH FLOWS FROM INVESTING ACTIVITIES:
Additions to property and equipment (2,548) (2,180) (1,805)
Proceeds from sale-leaseback transactions 1,562 204 601
Acquisitions (net of cash acquired) and other investments (101) (2,651) (1,984)
Purchase of short-term investments (5) – –
Sale of short-term investments – 28 –
Proceeds from sale or disposal of assets 23 19 106
Net cash used in investing activities (1,069) (4,580) (3,082)
CASH FLOWS FROM FINANCING ACTIVITIES:
Increase (decrease) in short-term debt (2,729) 959 242
Repayment of debt assumed in acquisition – (353) –
Issuance of long-term debt 2,800 350 6,000
Repayments of long-term debt (653) (2) (822)
Dividends paid (439) (383) (323)
Derivative settlements (3) – –
Proceeds from exercise of stock options 250 328 553
Excess tax benefits from stock-based compensation 19 53 98
Repurchase of common stock (2,477) (23) (5,370)
Net cash provided by (used in) financing activities (3,232) 929 378
Net increase (decrease) in cash and cash equivalents (266) 296 526
Cash and cash equivalents at beginning of year 1,352 1,056 530
Cash and cash equivalents at end of year $ 1,086 $ 1,352 $ 1,056
RECONCILIATION OF NET INCOME TO NET CASH
PROVIDED BY OPERATING ACTIVITIES:
Net income $ 3,696 $ 3,212 $ 2,637
Adjustments required to reconcile net income to net cash
provided by operating activities:
Depreciation and amortization 1,389 1,274 1,095
Stock-based compensation 165 92 78
Deferred income taxes and other non-cash items 48 (3) 39
Change in operating assets and liabilities, net of
effects from acquisitions:
Accounts receivable, net (86) (291) 280
Inventories (1,199) (488) (448)
Other current assets 48 12 (59)
Other assets (2) 19 (26)
Accounts payable 4 (64) (181)
Accrued expenses (66) 183 (168)
Other long-term liabilities 38 1 (17)
Net cash provided by operating activities $ 4,035 $ 3,947 $ 3,230
See accompanying notes to consolidated financial statements.
CVS Caremark
46