CVS 2009 Annual Report Download - page 74
Download and view the complete annual report
Please find page 74 of the 2009 CVS annual report below. You can navigate through the pages in the report by either clicking on the pages listed below, or by using the keyword search tool below to find specific information within the annual report.-
 1
1 -
2
-
3
-
4
-
5
-
6
-
7
-
8
-
9
-
10
-
11
-
12
-
13
-
14
-
15
-
16
-
17
-
18
-
19
-
20
-
21
-
22
-
23
-
24
-
25
-
26
-
27
-
28
-
29
-
30
-
31
-
32
-
33
-
34
-
35
-
36
-
37
-
38
-
39
-
40
-
41
-
42
-
43
-
44
-
45
-
46
-
47
-
48
-
49
-
50
-
51
-
52
-
53
-
54
-
55
-
56
-
57
-
58
-
59
-
60
-
61
-
62
-
63
-
 64
64 -
 65
65 -
 66
66 -
 67
67 -
 68
68 -
 69
69 -
 70
70 -
 71
71 -
 72
72 -
 73
73 -
 74
74 -
 75
75 -
 76
76 -
 77
77 -
 78
78 -
 79
79 -
 80
80
 |
 |

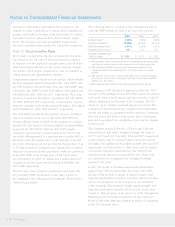
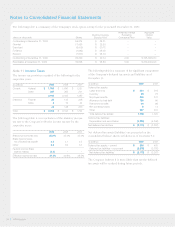
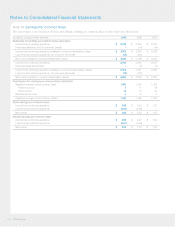
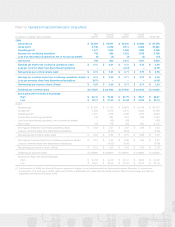
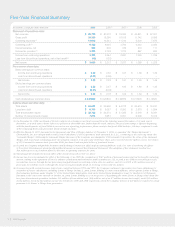
Notes to Consolidated Financial Statements
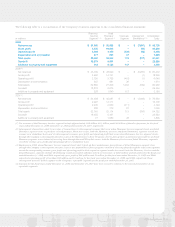
Note 14 Earnings Per Common Share
The following is a reconciliation of basic and diluted earnings per common share for the respective fiscal years:
in millions, except per share amounts 2009 2008 2007
Numerator for earnings per common share calculation:
Income from continuing operations $ 3,708 $ 3,344 $ 2,637
Preference dividends, net of income tax benefit – (14) (14)
Income from continuing operations available to common shareholders, basic $ 3,708 $ 3,330 $ 2,623
Loss from discontinued operations, net of income tax benefit (12) (132) –
Net income available to common shareholders, basic $ 3,696 $ 3,198 $ 2,623
Income from continuing operations 3,708 3,344 2,637
Dilutive earnings adjustments – (3) (4)
Income from continuing operations available to common shareholders, diluted 3,708 3,341 2,633
Loss from discontinued operations, net of income tax benefit (12) (132) –
Net income available to common shareholders, diluted $ 3,696 $ 3,209 $ 2,633
Denominator for earnings per common share calculation:
Weighted average common shares, basic 1,434 1,434 1,328
Preference stock 1 17 18
Stock options 10 13 23
Restricted stock units 5 5 3
Weighted average common shares, diluted 1,450 1,469 1,372
Basic earnings per common share:
Income from continuing operations $ 2.59 $ 2.32 $ 1.97
Loss from discontinued operations (0.01) (0.09) –
Net income $ 2.58 $ 2.23 $ 1.97
Diluted earnings per common share:
Income from continuing operations $ 2.56 $ 2.27 $ 1.92
Loss from discontinued operations (0.01) (0.09) –
Net income $ 2.55 $ 2.18 $ 1.92
CVS Caremark
70