CVS 2009 Annual Report Download - page 35
Download and view the complete annual report
Please find page 35 of the 2009 CVS annual report below. You can navigate through the pages in the report by either clicking on the pages listed below, or by using the keyword search tool below to find specific information within the annual report.-
 1
1 -
2
-
3
-
4
-
5
-
6
-
7
-
8
-
9
-
10
-
11
-
12
-
13
-
14
-
15
-
16
-
17
-
18
-
19
-
20
-
21
-
22
-
23
-
24
-
 25
25 -
 26
26 -
 27
27 -
 28
28 -
 29
29 -
 30
30 -
 31
31 -
 32
32 -
 33
33 -
 34
34 -
 35
35 -
 36
36 -
 37
37 -
 38
38 -
 39
39 -
 40
40 -
 41
41 -
 42
42 -
 43
43 -
 44
44 -
 45
45 -
46
-
47
-
48
-
49
-
50
-
51
-
52
-
53
-
54
-
55
-
56
-
57
-
58
-
59
-
60
-
61
-
62
-
63
-
64
-
65
-
66
-
67
-
68
-
69
-
70
-
71
-
72
-
73
-
74
-
75
-
76
-
77
-
78
-
79
-
80
 |
 |

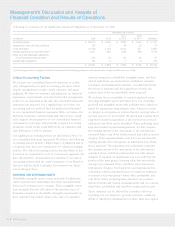
Net revenues. As you review our Retail Pharmacy segment’s
performance in this area, we believe you should consider the
following important information:
• During 2009, net revenues from the Longs Drug Stores
increased net revenues by $3.4 billion, compared to 2008.
This increase is primarily due to a full year of net revenues
associated with the Longs Drug Stores versus a partial
quarter in 2008.
• Three fewer days in the 2009 fiscal year negatively impacted
net revenues by $403 million, compared to 2008.
• During 2009, pharmacy same store sales were positively
impacted by the growth of our Maintenance Choice program.
• During 2008, net revenues from the Longs Drug Stores
increased net revenues by $1.0 billion, compared to 2007.
• Four additional days in the 2008 fiscal year increased net
revenues by $608 million, compared to 2007.
• As of December 31, 2009, we operated 7,025 retail stores,
compared to 6,923 retail stores on December 31, 2008.
Total net revenues from new stores (excluding acquired
stores) contributed approximately 1.6%, 1.5% and 1.3% to
Retail Pharmacy Segment
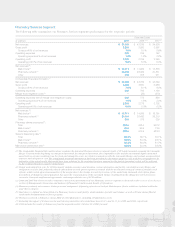
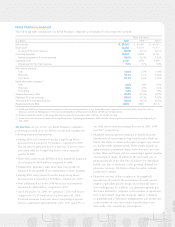
The following table summarizes our Retail Pharmacy segment’s performance for the respective periods:
Fiscal Year Ended
in millions 2009 2008 (1) (2) 2007 (1)
Net revenues $ 55,355 $ 48,990 $ 45,087
Gross profit 16,593 14,741 13,111
Gross profit % of net revenues 30.0% 30.1% 29.1%
Operating expenses 12,434 10,988 10,151
Operating expenses % of net revenues 22.5% 22.4% 22.5%
Operating profit 4,159 3,753 2,960
Operating profit % of net revenues 7.5% 7.7% 6.6%
Net revenue increase:
Total 13.0% 8.7% 11.9%
Pharmacy 13.1% 8.1% 10.9%
Front Store 12.7% 9.9% 14.0%
Same store sales increase: (3)
Total 5.0% 4.5% 5.3%
Pharmacy 6.9% 4.8% 5.2%
Front Store 1.2% 3.6% 5.3%
Generic dispensing rates 69.9% 67.4% 63.2%
Pharmacy % of net revenues 67.5% 67.5% 67.8%
Third party % of pharmacy revenue 96.9% 96.1% 95.3%
Retail prescriptions filled 616.5 559.0 527.5
(1) 2008 and 2007 have been revised to conform to the current presentation of our Retail Pharmacy segment as discussed in the Overview of Our
Business section on Management’s Discussion and Analysis of Financial Condition and Results of Operations.
(2) 2008 includes the results of the Longs Drug Stores from the acquisition date (October 20, 2008) forward.
(3) Same store sales increase includes the Longs Drug Stores beginning in November 2009 and the stores acquired from Albertson’s, Inc. beginning in
July 2007.
our total net revenue percentage increase in 2009, 2008
and 2007, respectively.
• Pharmacy revenue growth continued to benefit from the
introduction of a prescription drug benefit under Medicare
Part D, the ability to attract and retain managed care custom-
ers and favorable industry trends. These trends include an
aging American population; many “baby boomers” are now
in their fifties and sixties and are consuming a greater number
of prescription drugs. In addition, the increased use of
pharmaceuticals as the first line of defense for individual
health care also contributed to the growing demand for
pharmacy services. We believe these favorable industry
trends will continue.
• Pharmacy revenue dollars continue to be negatively
impacted in all years by the conversion of brand named
drugs to equivalent generic drugs, which typically have a
lower selling price. In addition, our pharmacy growth has
also been affected by a decline in the number of significant
new brand named drug introductions, higher consumer
co-payments and co-insurance arrangements, and an increase
in the number of over-the-counter remedies that were
historically only available by prescription.
2009 Annual Report 31