CVS 2009 Annual Report Download - page 68
Download and view the complete annual report
Please find page 68 of the 2009 CVS annual report below. You can navigate through the pages in the report by either clicking on the pages listed below, or by using the keyword search tool below to find specific information within the annual report.-
 1
1 -
2
-
3
-
4
-
5
-
6
-
7
-
8
-
9
-
10
-
11
-
12
-
13
-
14
-
15
-
16
-
17
-
18
-
19
-
20
-
21
-
22
-
23
-
24
-
25
-
26
-
27
-
28
-
29
-
30
-
31
-
32
-
33
-
34
-
35
-
36
-
37
-
38
-
39
-
40
-
41
-
42
-
43
-
44
-
45
-
46
-
47
-
48
-
49
-
50
-
51
-
52
-
53
-
54
-
55
-
56
-
57
-
 58
58 -
 59
59 -
 60
60 -
 61
61 -
 62
62 -
 63
63 -
 64
64 -
 65
65 -
 66
66 -
 67
67 -
 68
68 -
 69
69 -
 70
70 -
 71
71 -
 72
72 -
 73
73 -
 74
74 -
 75
75 -
 76
76 -
 77
77 -
 78
78 -
79
-
80
 |
 |

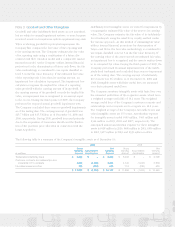
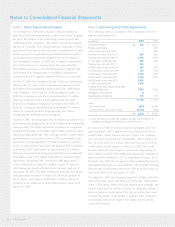
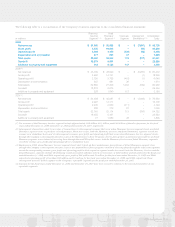
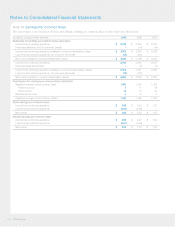
Notes to Consolidated Financial Statements
The following table is a summary of the significant components
of the Company’s deferred tax assets and liabilities as of
December 31:
in millions 2009 2008
Deferred tax assets:
Lease and rents $ 334 $ 318
Inventory 55 73
Employee benefits 250 241
Allowance for bad debt 130 95
Retirement benefits 94 98
Net operating losses 8 13
Other 287 241
Total deferred tax assets 1,158 1,079
Deferred tax liabilities:
Depreciation and amortization (4,330) (4,346)
Net deferred tax liabilities $ (3,172) $ (3,267)
Net deferred tax assets (liabilities) are presented on the
consolidated balance sheets as follows as of December 31:
in millions 2009 2008
Deferred tax assets – current $ 506 $ 435
Deferred tax liabilities – noncurrent (3,678) (3,702)
Net deferred tax liabilities $ (3,172) $ (3,267)
The Company believes it is more likely than not the deferred
tax assets will be realized during future periods.
The following table is a summary of the Company’s stock option activity for the year-ended December 31, 2009:
Weighted Average Aggregate
Weighted Average Remaining Intrinsic
shares in thousands Shares Exercise Price Contractual Term Value
Outstanding at December 31, 2008 59,374 $ 28.21 – –
Granted 17,436 $ 28.63 – –
Exercised (8,419) $ 20.72 – –
Forfeited (1,085) $ 36.48 – –
Expired (1,037) $ 28.34 – –
Outstanding at December 31, 2009 66,269 $ 29.14 4.39 $ 345,068,000
Exercisable at December 31, 2009 35,858 $ 25.84 3.30 $ 279,462,000
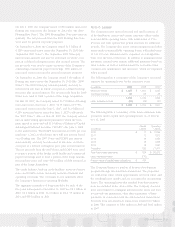
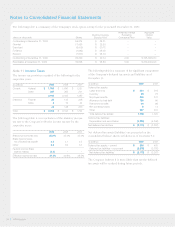
Note 11 Income Taxes
The income tax provision consisted of the following for the
respective years:
in millions 2009 2008 2007
Current: Federal $ 1,766 $ 1,680 $ 1,251
State 397 365 241
2,163 2,045 1,492
Deferred: Federal 38 133 206
State 4 15 24
42 148 230
Total $ 2,205 $ 2,193 $ 1,722
The following table is a reconciliation of the statutory income
tax rate to the Company’s effective income tax rate for the
respective years:
2009 2008 2007
Statutory income tax rate 35.0% 35.0% 35.0%
State income taxes,
net of federal tax benefit 4.5 4.1 4.2
Other 0.6 0.5 0.3
Federal and net State
reserve release (2.8) – –
Effective income tax rate 37.3% 39.6% 39.5%
CVS Caremark
64