CVS 2009 Annual Report Download - page 73
Download and view the complete annual report
Please find page 73 of the 2009 CVS annual report below. You can navigate through the pages in the report by either clicking on the pages listed below, or by using the keyword search tool below to find specific information within the annual report.-
 1
1 -
2
-
3
-
4
-
5
-
6
-
7
-
8
-
9
-
10
-
11
-
12
-
13
-
14
-
15
-
16
-
17
-
18
-
19
-
20
-
21
-
22
-
23
-
24
-
25
-
26
-
27
-
28
-
29
-
30
-
31
-
32
-
33
-
34
-
35
-
36
-
37
-
38
-
39
-
40
-
41
-
42
-
43
-
44
-
45
-
46
-
47
-
48
-
49
-
50
-
51
-
52
-
53
-
54
-
55
-
56
-
57
-
58
-
59
-
60
-
61
-
62
-
 63
63 -
 64
64 -
 65
65 -
 66
66 -
 67
67 -
 68
68 -
 69
69 -
 70
70 -
 71
71 -
 72
72 -
 73
73 -
 74
74 -
 75
75 -
 76
76 -
 77
77 -
 78
78 -
 79
79 -
 80
80
 |
 |

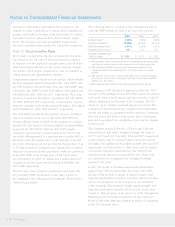
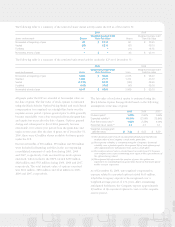
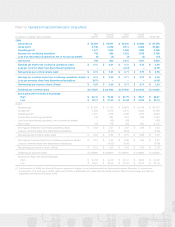
The following table is a reconciliation of the Company’s business segments to the consolidated financial statements:
Pharmacy Retail
Services Pharmacy Corporate Intersegment Consolidated
in millions Segment (1) (3) Segment (3) Segment Eliminations (2) (3) Totals
2009:
Net revenues $ 51,065 $ 55,355 $ – $ (7,691) $ 98,729
Gross profit 3,835 16,593 – (48) 20,380
Operating profit 2,866 4,159 (539) (48) 6,438
Depreciation and amortization 377 965 47 – 1,389
Total assets 33,082 28,302 774 (517) 61,641
Goodwill 18,879 6,801 – – 25,680
Additions to property and equipment 218 2,183 147 – 2,548
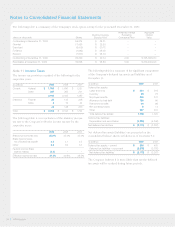
2008 (4):
Net revenues $ 43,769 $ 48,990 $ – $ (5,287) $ 87,472
Gross profit 3,550 14,741 – (1) 18,290
Operating profit 2,755 3,753 (461) (1) 6,046
Depreciation and amortization 357 881 36 – 1,274
Total assets 32,850 27,406 1,053 (349) 60,960
Goodwill 18,818 6,676 – – 25,494
Additions to property and equipment 228 1,840 112 – 2,180
2007 (4):
Net revenues $ 34,938 $ 45,087 $ – $ (3,695) $ 76,330
Gross profit 2,997 13,111 – – 16,108
Operating profit 2,245 2,960 (411) – 4,794
Depreciation and amortization 289 779 27 – 1,095
Total assets 32,091 22,174 713 (256) 54,722
Goodwill 18,455 5,467 – – 23,922
Additions to property and equipment 77 1,680 48 – 1,805
(1) Net revenues of the Pharmacy Services segment include approximately $6.9 billion, $6.3 billion, and $4.6 billion of Retail co-payments for the fiscal
years ended December 31, 2009, December 31, 2008 and December 29, 2007, respectively.
(2) Intersegment eliminations relate to two types of transactions: (i) Intersegment revenues that occur when Pharmacy Services segment clients use Retail
Pharmacy segment stores to purchase covered products. When this occurs, both the Pharmacy Services and Retail Pharmacy segments record the
revenue on a standalone basis and (ii) Intersegment revenues, gross profit and operating profit that occur when Pharmacy Services segment clients,
through the Company’s intersegment activities (such as the Maintenance Choice Program), elect to pick up their maintenance prescriptions at Retail
Pharmacy segment stores instead of receiving them through the mail. When this occurs, both the Pharmacy Services and Retail Pharmacy segments
record the revenue, gross profit and operating profit on a standalone basis.
(3) Beginning in 2008, when Pharmacy Services segment clients elect to pick up their maintenance prescriptions at Retail Pharmacy segment stores
through the Company’s intersegment activities (such as the Maintenance Choice program) instead of receiving them through the mail, both segments
record the corresponding revenue, gross profit and operating profit in their respective segment results. As a result, both the Pharmacy Services and the
Retail Pharmacy segments include the following results associated with this activity: net revenues of $692 million and $8 million for the fiscal year
ended December 31, 2009 and 2008, respectively; gross profit of $48 million and $1 million for the fiscal year ended December 31, 2009 and 2008,
respectively; operating profit of less than $48 million and $1 million for the fiscal year ended December 31, 2009 and 2008, respectively. These
intersegment activities had no impact on the Company’s reportable segments for the fiscal year ended December 29, 2007.
(4) Amounts for the fiscal years ended December 31, 2008 and December 29, 2007 have been revised to conform to the current presentation of our
reportable segments.
2009 Annual Report 69