CVS 2009 Annual Report Download - page 34
Download and view the complete annual report
Please find page 34 of the 2009 CVS annual report below. You can navigate through the pages in the report by either clicking on the pages listed below, or by using the keyword search tool below to find specific information within the annual report.-
 1
1 -
2
-
3
-
4
-
5
-
6
-
7
-
8
-
9
-
10
-
11
-
12
-
13
-
14
-
15
-
16
-
17
-
18
-
19
-
20
-
21
-
22
-
23
-
 24
24 -
 25
25 -
 26
26 -
 27
27 -
 28
28 -
 29
29 -
 30
30 -
 31
31 -
 32
32 -
 33
33 -
 34
34 -
 35
35 -
 36
36 -
 37
37 -
 38
38 -
 39
39 -
 40
40 -
 41
41 -
 42
42 -
 43
43 -
 44
44 -
45
-
46
-
47
-
48
-
49
-
50
-
51
-
52
-
53
-
54
-
55
-
56
-
57
-
58
-
59
-
60
-
61
-
62
-
63
-
64
-
65
-
66
-
67
-
68
-
69
-
70
-
71
-
72
-
73
-
74
-
75
-
76
-
77
-
78
-
79
-
80
 |
 |

Management’s Discussion and Analysis of
Financial Condition and Results of Operations
• In conjunction with a recently approved class action settle-
ment with two entities that publish the average wholesale
price (“AWP”) of pharmaceuticals (a pricing benchmark
widely used in the pharmacy industry), the AWP for many
brand-name and some generic prescription drugs were
reduced effective September 26, 2009. We have reached
understandings with most of our commercial third-party
payors where we participate as pharmacy providers to adjust
reimbursements to account for this change in methodology,
but most state Medicaid programs that utilize AWP as a pricing
reference have not taken action to make similar adjustments.
As a result, we expect reduced Medicaid reimbursement
levels in fiscal 2010.
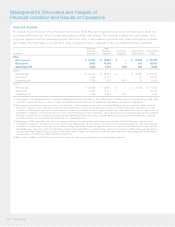
Operating expenses, which include selling, general and adminis-
trative expenses (including integration and other merger-related
expenses), depreciation and amortization related to selling,
general and administrative activities and retail specialty
pharmacy store and administrative payroll, employee benefits
and occupancy costs increased to 1.9% of net revenues in
2009, compared to 1.8% and 2.2% in 2008 and 2007, respectively.
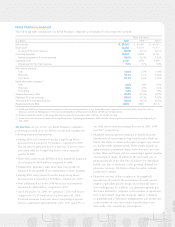
As you review our Pharmacy Services segment’s performance
in this area, we believe you should consider the following
important information:
• During 2009, the increase in operating expenses is primarily
related to (i) increased litigation reserves, (ii) the dissolution
of our joint venture with Universal American Corporation
(“UAC”) at the end of fiscal 2008, the income from which
was historically an offset to operating expenses, and (iii) the
inclusion of a full year of RxAmerica’s operating expenses
during 2009.
• During 2008, comparable operating expenses decreased
9.8% to $772 million (or 1.8% of net revenues), compared
to $856 million (or 2.0% of net revenues) during 2007. Our
comparable results include incremental depreciation and
amortization expense resulting from the fixed and intangible
assets recorded in connection with the Caremark Merger, but
exclude merger-related expenses and integration costs.
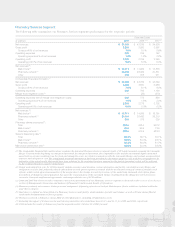
applicable accounting rules. Under these rules, the majority
of Caremark’s national retail network contracts are accounted
for using the gross method, which results in higher revenues,
higher cost of revenues and lower gross profit rates. The
conversion of certain PharmaCare contracts and RxAmerica
contracts to the Caremark contract structure increased our
net revenues, increased our cost of revenues and lowered
our gross profit rates. Although this change did not affect
our gross profit dollars, it did reduce our gross profit rates
by approximately 40, 35 and 20 basis points during 2009,
2008 and 2007, respectively.
• Our gross profit as a percentage of revenues benefited
from the increase in our total generic dispensing rate, which
increased to 68.2% and 65.1% in 2009 and 2008, respectively,
compared to our comparable generic dispensing rate of
60.1% in 2007. These increases were primarily due to new
generic drug introductions and our continued efforts to
encourage plan members to use generic drugs when they
are available. In addition, during 2009, the inclusion of a
full year of RxAmerica claims increased our total generic
dispensing rate by approximately 120 and 20 basis points
during 2009 and 2008, respectively.
• During 2008, our comparable gross profit rate was impacted by
decreases in our mail penetration rate to 22.9%, compared to
28.2% in 2007. This and the impact of accounting for certain
PharmaCare contracts using the gross method were offset, in
part, by increases in the utilization of generic drugs, which
normally yield a higher gross profit rate than equivalent
brand name drugs.
• During 2008, our comparable gross profit rates benefited
from the purchasing synergies from the Caremark Merger.
• In January 2009, the Centers for Medicare and Medicaid
Services (“CMS”) issued a regulation requiring that, beginning
in 2010, any difference between the drug price charged to
Medicare Part D plan sponsors by a PBM and the drug paid
by the PBM to the dispensing provider (commonly called
“differential” or “spread”) be reported as an administrative
cost rather than a drug cost of the plan sponsor for purposes
of calculating certain government subsidy payments and the
drug price to be charged to enrollees. These changes impact
our ability to offer Medicare Part D plan sponsors pricing for
2010 that includes the use of retail network “differential” or
“spread,” and we expect these changes to reduce the profitabil-
ity of our Medicare Part D business beginning in 2010.
CVS Caremark
30