Berkshire Hathaway 1999 Annual Report Download - page 7
Download and view the complete annual report
Please find page 7 of the 1999 Berkshire Hathaway annual report below. You can navigate through the pages in the report by either clicking on the pages listed below, or by using the keyword search tool below to find specific information within the annual report.-
 1
1 -
 2
2 -
 3
3 -
 4
4 -
 5
5 -
 6
6 -
 7
7 -
 8
8 -
 9
9 -
 10
10 -
 11
11 -
 12
12 -
 13
13 -
 14
14 -
 15
15 -
 16
16 -
 17
17 -
 18
18 -
19
-
20
-
21
-
22
-
23
-
24
-
25
-
26
-
27
-
28
-
29
-
30
-
31
-
32
-
33
-
34
-
35
-
36
-
37
-
38
-
39
-
40
-
41
-
42
-
43
-
44
-
45
-
46
-
47
-
48
-
49
-
50
-
51
-
52
-
53
-
54
-
55
-
56
-
57
-
58
-
59
-
60
-
61
-
62
-
63
-
64
-
65
-
66
-
67
-
68
-
69
-
70
-
71
-
72
-
73
-
74
 |
 |

6
If a manager has behaved similarly at some other public corporation, I haven’t heard about it. You can understand
why the opportunity to partner with people like Bill Child causes me to tap dance to work every morning.
* * * * * * * * * * * *
A footnote: After our “soft” opening in August, we had a grand opening of the Boise store about a month later.
Naturally, I went there to cut the ribbon (your Chairman, I wish to emphasize, is good for something). In my talk I told
the crowd how sales had far exceeded expectations, making us, by a considerable margin, the largest home furnishings
store in Idaho. Then, as the speech progressed, my memory miraculously began to improve. By the end of my talk, it
all had come back to me: Opening a store in Boise had been my idea.
The Economics of Property/Casualty Insurance
Our main business — though we have others of great importance — is insurance. To understand Berkshire,
therefore, it is necessary that you understand how to evaluate an insurance company. The key determinants are: (1) the
amount of float that the business generates; (2) its cost; and (3) most critical of all, the long-term outlook for both of these
factors.
To begin with, float is money we hold but don't own. In an insurance operation, float arises because premiums are
received before losses are paid, an interval that sometimes extends over many years. During that time, the insurer invests
the money. This pleasant activity typically carries with it a downside: The premiums that an insurer takes in usually
do not cover the losses and expenses it eventually must pay. That leaves it running an "underwriting loss," which is the
cost of float. An insurance business has value if its cost of float over time is less than the cost the company would
otherwise incur to obtain funds. But the business is a lemon if its cost of float is higher than market rates for money.
A caution is appropriate here: Because loss costs must be estimated, insurers have enormous latitude in figuring
their underwriting results, and that makes it very difficult for investors to calculate a company's true cost of float. Errors
of estimation, usually innocent but sometimes not, can be huge. The consequences of these miscalculations flow directly
into earnings. An experienced observer can usually detect large-scale errors in reserving, but the general public can
typically do no more than accept what's presented, and at times I have been amazed by the numbers that big-name
auditors have implicitly blessed. In 1999 a number of insurers announced reserve adjustments that made a mockery of
the “earnings” that investors had relied on earlier when making their buy and sell decisions. At Berkshire, we strive to
be conservative and consistent in our reserving. Even so, we warn you that an unpleasant surprise is always possible.
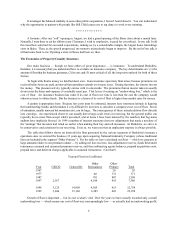
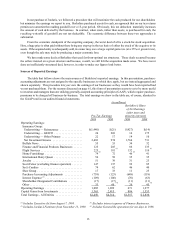
The table that follows shows (at intervals) the float generated by the various segments of Berkshire’s insuranc e
operations since we entered the business 33 years ago upon acquiring National Indemnity Company (whose traditional
lines are included in the segment “Other Primary”). For the table we have calculated our float — which we generate in
large amounts relative to our premium volume — by adding net loss reserves, loss adjustment reserves, funds held under
reinsurance assumed and unearned premium reserves, and then subtracting agents balances, prepaid acquisition costs,
prepaid taxes and deferred charges applicable to assumed reinsurance. (Got that?)
Yearend Float (in $ millions)
Year GEICO General Re Reinsurance Primary Total
Other Other
1967 20 20
1977 40 131 171
1987 701 807 1,508
1997 2,917 4,014 455 7,386
1998 3,125 14,909 4,305 415 22,754
1999 3,444 15,166 6,285 403 25,298
Growth of float is important — but its cost is what’s vital. Over the years we have usually recorded only a small
underwriting loss — which means our cost of float was correspondingly low — or actually had an underwriting profit,