Berkshire Hathaway 1999 Annual Report Download - page 46
Download and view the complete annual report
Please find page 46 of the 1999 Berkshire Hathaway annual report below. You can navigate through the pages in the report by either clicking on the pages listed below, or by using the keyword search tool below to find specific information within the annual report.-
 1
1 -
2
-
3
-
4
-
5
-
6
-
7
-
8
-
9
-
10
-
11
-
12
-
13
-
14
-
15
-
16
-
17
-
18
-
19
-
20
-
21
-
22
-
23
-
24
-
25
-
26
-
27
-
28
-
29
-
30
-
31
-
32
-
33
-
34
-
35
-
 36
36 -
 37
37 -
 38
38 -
 39
39 -
 40
40 -
 41
41 -
 42
42 -
 43
43 -
 44
44 -
 45
45 -
 46
46 -
 47
47 -
 48
48 -
 49
49 -
 50
50 -
 51
51 -
 52
52 -
 53
53 -
 54
54 -
 55
55 -
 56
56 -
57
-
58
-
59
-
60
-
61
-
62
-
63
-
64
-
65
-
66
-
67
-
68
-
69
-
70
-
71
-
72
-
73
-
74
 |
 |

45
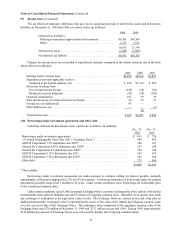
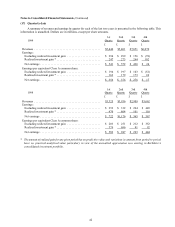
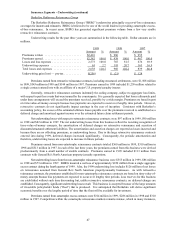
Insurance Segments - Underwriting (continued)
General Re
On December 21, 1998, General Re became a wholly owned subsidiary of Berkshire upon completion of the merger
of the two companies. General Re’s results of operations are included in Berkshire’s consolidated results beginning as of
that date. For comparative purposes in this discussion, the historical results for all of 1998 are presented although the full-
year results are not included in Berkshire’s 1998 consolidated results.
General Re and its affiliates conduct a global reinsurance business, which provides reinsurance coverage in the
United States and 125 other countries around the world. General Re’s principal reinsurance operations are: (1) Nort h
American property/casualty, (2) International property/casualty, and (3) Global life/health. The International
property/casualty operations are conducted primarily through Germany-based Cologne Re and its subsidiaries. At December
31, 1999, General Re had an 88% economic ownership interest in Cologne Re.
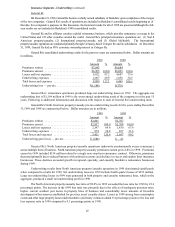
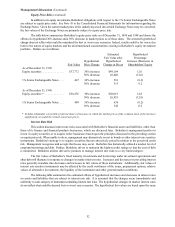
General Re’s consolidate d underwriting results for the past two years are summarized below. Dollar amounts are
in millions.
1999 1998
Amount %Amount %
Premiums written ........................... $7,043 $6,084
Premiums earned ............................ $6,905 100.0 $6,095 100.0
Losses and loss expenses ...................... 6,022 87.2 4,607 75.6
Underwriting expenses ....................... 2,067 29.9 1,858 30.5
Total losses and expenses ..................... 8,089 117.1 6,465 106.1
Underwriting loss — pre-tax ................... $(1,184) $(370)
General Re’s reinsurance operations produced large net underwriting losses in 1999. The aggregate net
underwriting loss of $1,184 million in 1999 is the worst annual underwriting result of the company over the past 15
years. Following is additional information and discussion with respect to each of General Re’s underwriting units.
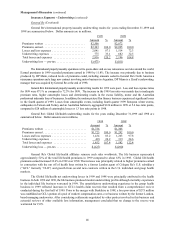
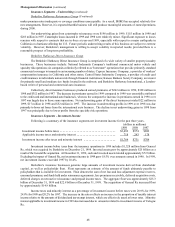
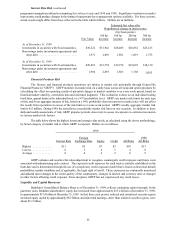
General Re’s North Ameri can property/casualty pre-tax underwriting results for the years ending December
31,1999 and 1998 are summarized below. Dollar amounts are in millions.
1999 1998
Amount %Amount %
Premiums written ........................... $2,801 $2,707
Premiums earned ............................ $2,837 100.0 $2,708 100.0
Losses and loss expenses ...................... 2,547 89.8 1,830 67.6
Underwriting expenses ....................... 874 30.8 857 31.6
Total losses and expenses ..................... 3,421 120.6 2,687 99.2
Underwriting gain (loss) — pre-tax .............. $ (584)$ 21
General Re’s North American property/casualty operations underwrite predominantly excess reinsuranc e
across multiple lines of business. North American property/casualty premiums earned grew 4.8% in 1999. Premiums
earned in 1999 included $154 million related to a single new stop-loss reinsurance contract. Otherwise, premiums
decreased primarily due to reduced business with national accounts and declines in excess and surplus lines insurance
businesses. These declines exceeded growth in regional, specialty, and casualty facultative reinsurance businesses
during 1999.
Underwriting results from North American property/casualty operations in 1999 deteriorated significantly
when compared to results for 1998. Net underwriting losses in 1999 include fourth quarter losses of $353 million.
Large net underwriting losses in 1999 were generated in both property and casualty reinsurance lines, which in the
aggregate, produced a small net underwriting profit in 1998.
The North American property/casualty loss ratio of 89.8% in 1999 exceeded the loss ratio for 1998 by 22.2
percentage points. The increase in the 1999 loss ratio was primarily due to the effects of inadequate premium rates,
higher current accident year losses in property lines of business and considerably lower amounts of favorable
development of loss reserves established for previous years' casualty claims. Losses in 1999 arising from catastrophic
events and other large property losses under facultative and treaty contracts added 9.4 percentage points to the loss and
loss expense ratio in 1999 compared to 4.1 percentage points in 1998.