Berkshire Hathaway 1999 Annual Report Download - page 16
Download and view the complete annual report
Please find page 16 of the 1999 Berkshire Hathaway annual report below. You can navigate through the pages in the report by either clicking on the pages listed below, or by using the keyword search tool below to find specific information within the annual report.-
 1
1 -
2
-
3
-
4
-
5
-
 6
6 -
 7
7 -
 8
8 -
 9
9 -
 10
10 -
 11
11 -
 12
12 -
 13
13 -
 14
14 -
 15
15 -
 16
16 -
 17
17 -
 18
18 -
 19
19 -
 20
20 -
 21
21 -
 22
22 -
 23
23 -
 24
24 -
 25
25 -
 26
26 -
27
-
28
-
29
-
30
-
31
-
32
-
33
-
34
-
35
-
36
-
37
-
38
-
39
-
40
-
41
-
42
-
43
-
44
-
45
-
46
-
47
-
48
-
49
-
50
-
51
-
52
-
53
-
54
-
55
-
56
-
57
-
58
-
59
-
60
-
61
-
62
-
63
-
64
-
65
-
66
-
67
-
68
-
69
-
70
-
71
-
72
-
73
-
74
 |
 |

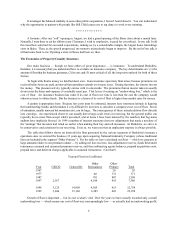
15
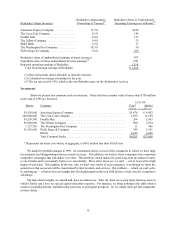
Berkshire's Approximate Berkshire's Share of Undistributed
Berkshire's Major Investees Ownership at Yearend Operating Earnings (in millions)
(1) (2)
American Express Company .............. 11.3% $228
The Coca-Cola Company ................. 8.1% 144
Freddie Mac .......................... 8.6% 127
The Gillette Company ................... 9.0% 53
M&T Bank ........................... 6.5% 17
The Washington Post Company ............ 18.3% 30
Wells Fargo & Company ................. 3.6% 108
Berkshire's share of undistributed earnings of major investees 707
Hypothetical tax on these undistributed investee earnings (99)
(3)
Reported operating earnings of Berkshire 1,318
Total look-through earnings of Berkshire $ 1,926
(1) Does not include shares allocable to minority interests
(2) Calculated on average ownership for the year
(3) The tax rate used is 14%, which is the rate Berkshire pays on the dividends it receives
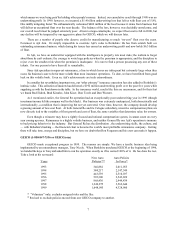
Investments
Below we present our common stock investments. Those that had a market value of more than $750 million
at the end of 1999 are itemized. 12/31/99
Shares Company Cost* Market
(dollars in millions)
50,536,900 American Express Company ................................ $1,470 $ 8,402
200,000,000 The Coca-Cola Company ................................... 1,299 11,650
59,559,300 Freddie Mac ............................................ 294 2,803
96,000,000 The Gillette Company ..................................... 600 3,954
1,727,765 The Washington Post Company .............................. 11 960
59,136,680 Wells Fargo & Company ................................... 349 2,391
Others ................................................. 4,180 6,848
Total Common Stocks ..................................... $8,203 $37,008
* Represents tax-basis cost which, in aggregate, is $691 million less than GAAP cost.
We made few portfolio changes in 1999. As I mentioned earlier, several of the companies in which we have large
investments had disappointing business results last year. Nevertheless, we believe these companies have important
competitive advantages that will endure over time. This attribute, which makes for good long-term investment results,
is one Charlie and I occasionally believe we can identify. More often, however, we can’t — not at least with a high
degree of conviction. This explains, by the way, why we don’t own stocks of tech companies, even though we share the
general view that our society will be transformed by their products and services. Our problem — which we can’t solve
by studying up — is that we have no insights into which participants in the tech field possess a truly durable competitive
advantage.
Our lack of tech insights, we should add, does not distress us. After all, there are a great many business areas in
which Charlie and I have no special capital-allocation expertise. For instance, we bring nothing to the table when it
comes to evaluating patents, manufacturing processes or geological prospects. So we simply don’t get into judgments
in those fields.