Berkshire Hathaway 1999 Annual Report Download - page 15
Download and view the complete annual report
Please find page 15 of the 1999 Berkshire Hathaway annual report below. You can navigate through the pages in the report by either clicking on the pages listed below, or by using the keyword search tool below to find specific information within the annual report.-
 1
1 -
2
-
3
-
4
-
 5
5 -
 6
6 -
 7
7 -
 8
8 -
 9
9 -
 10
10 -
 11
11 -
 12
12 -
 13
13 -
 14
14 -
 15
15 -
 16
16 -
 17
17 -
 18
18 -
 19
19 -
 20
20 -
 21
21 -
 22
22 -
 23
23 -
 24
24 -
 25
25 -
26
-
27
-
28
-
29
-
30
-
31
-
32
-
33
-
34
-
35
-
36
-
37
-
38
-
39
-
40
-
41
-
42
-
43
-
44
-
45
-
46
-
47
-
48
-
49
-
50
-
51
-
52
-
53
-
54
-
55
-
56
-
57
-
58
-
59
-
60
-
61
-
62
-
63
-
64
-
65
-
66
-
67
-
68
-
69
-
70
-
71
-
72
-
73
-
74
 |
 |
14
Almost all of our manufacturing, retailing and service businesses had excellent results in 1999. The exception
was Dexter Shoe, and there the shortfall did not occur because of managerial problems: In skills, energy and devotion
to their work, the Dexter executives are every bit the equal of our other managers. But we manufacture shoes primarily
in the U.S., and it has become extremely difficult for domestic producers to compete effectively. In 1999, approximately
93% of the 1.3 billion pairs of shoes purchased in this country came from abroad, where extremely low-cost labor is the
rule.
Counting both Dexter and H. H. Brown, we are currently the leading domestic manufacturer of shoes, and we are
likely to continue to be. We have loyal, highly-skilled workers in our U.S. plants, and we want to retain every job here
that we can. Nevertheless, in order to remain viable, we are sourcing more of our output internationally. In doing that,
we have incurred significant severance and relocation costs that are included in the earnings we show in the table.
A few years back, Helzberg’s, our 200-store jewelry operation, needed to make operating adjustments to restore
margins to appropriate levels. Under Jeff Comment’s leadership, the job was done and profits have dramaticall y
rebounded. In the shoe business, where we have Harold Alfond, Peter Lunder, Frank Rooney and Jim Issler in charge,
I believe we will see a similar improvement over the next few years.
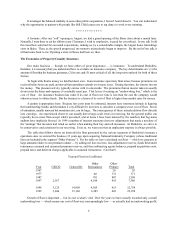
See’s Candies deserves a special comment, given that it achieved a record operating margin of 24% last year.
Since we bought See’s for $25 million in 1972, it has earned $857 mi llion pre-tax. And, despite its growth, the business
has required very little additional capital. Give the credit for this performance to Chuck Huggins. Charlie and I put
him in charge the day of our purchase, and his fanatical insistence on both product quality and friendly service has
rewarded customers, employees and owners.
Chuck gets better every year. When he took charge of See’s at age 46, the company’s pre-tax profit, expressed
in millions, was about 10% of his age. Today he’s 74, and the ratio has increased to 100%. Having discovered this
mathematical relationship — let’s call it Huggins’ Law — Charlie and I now become giddy at the mere thought o f
Chuck’s birthday.
* * * * * * * * * * * *
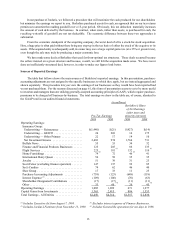
Additional information about our various businesses is given on pages 39 - 54, where you will also find our
segment earnings reported on a GAAP basis. In addition, on pages 63 - 69, we have rearranged Berkshire's financial
data into four segments on a non-GAAP basis, a presentation that corresponds to the way Charlie and I think about the
company.
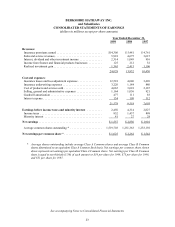
Look-Through Earnings
Reported earnings are an inadequate measure of economic progress at Berkshire, in part because the numbers
shown in the table presented earlier include only the dividends we receive from investees — though these dividends
typically represent only a small fraction of the earnings attributable to our ownership. Not that we mind this division
of money, since on balance we regard the undistributed earnings of investees as more valuable to us than the portion
paid out. The reason for our thinking is simple: Our investees often have the opportunity to reinvest earnings at high
rates of return. So why should we want them paid out?
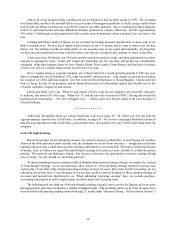
To depict something closer to economic reality at Berkshire than reported earnings, though, we employ the concept
of "look-through" earnings. As we calculate these, they consist of: (1) the operating earnings reported in the previous
section, plus; (2) our share of the retained operating earnings of major investees that, under GAAP accounting, are not
reflected in our profits, less; (3) an allowance for the tax that would be paid by Berkshire if these retained earnings of
investees had instead been distributed to us. When tabulating "operating earnings" here, we exclude purchase-
accounting adjustments as well as capital gains and other major non-recurring items.
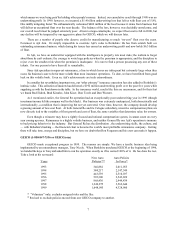
The following table sets forth our 1999 look-through earnings, though I warn you that the figures can be no more
than approximate, since they are based on a number of judgment calls. (The dividends paid to us by these investees have
been included in the operating earnings itemized on page 13, mostly under "Insurance Group: Net Investment Income.")