Berkshire Hathaway 1999 Annual Report Download - page 14
Download and view the complete annual report
Please find page 14 of the 1999 Berkshire Hathaway annual report below. You can navigate through the pages in the report by either clicking on the pages listed below, or by using the keyword search tool below to find specific information within the annual report.-
 1
1 -
2
-
3
-
 4
4 -
 5
5 -
 6
6 -
 7
7 -
 8
8 -
 9
9 -
 10
10 -
 11
11 -
 12
12 -
 13
13 -
 14
14 -
 15
15 -
 16
16 -
 17
17 -
 18
18 -
 19
19 -
 20
20 -
 21
21 -
 22
22 -
 23
23 -
 24
24 -
25
-
26
-
27
-
28
-
29
-
30
-
31
-
32
-
33
-
34
-
35
-
36
-
37
-
38
-
39
-
40
-
41
-
42
-
43
-
44
-
45
-
46
-
47
-
48
-
49
-
50
-
51
-
52
-
53
-
54
-
55
-
56
-
57
-
58
-
59
-
60
-
61
-
62
-
63
-
64
-
65
-
66
-
67
-
68
-
69
-
70
-
71
-
72
-
73
-
74
 |
 |

13
In our purchase of Jordan’s, we followed a procedure that will maximize the cash produced for our shareholders
but minimize the earnings we report to you. Berkshire purchased assets for cash, an approach that on our tax returns
permits us to amortize the resulting goodwill over a 15-year period. Obviously, this tax deduction materially increases
the amount of cash delivered by the business. In contrast, when stock, rather than assets, is purchased for cash, the
resulting writeoffs of goodwill are not tax-deductible. The economic difference between these two approaches is
substantial.
From the economic standpoint of the acquiring company, the worst deal of all is a stock-for-stock acquisition.
Here, a huge price is often paid without there being any step-up in the tax basis of either the stock of the acquiree or its
assets. If the acquired entity is subsequently sold, its owner may owe a large capital gains tax (at a 35% or greater rate),
even though the sale may truly be producing a major economic loss.
We have made some deals at Berkshire that used far-from-optimal tax structures. These deals occurred because
the sellers insisted on a given structure and because, overall, we still felt the acquisition made sense. We have never
done an inefficiently-structured deal, however, in order to make our figures look better.
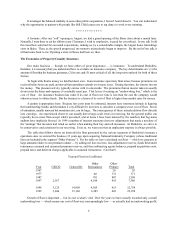
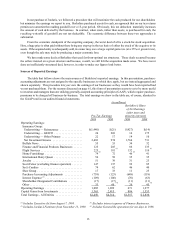
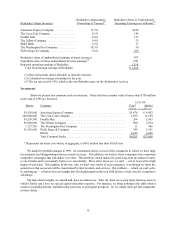
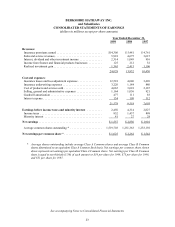
Sources of Reported Earnings
The table that follows shows the main sources of Berkshire's reported earnings. In this presentation, purchase-
accounting adjustments are not assigned to the specific businesses to which they apply, but are instead aggregated and
shown separately. This procedure lets you view the earnings of our businesses as they would have been reported had
we not purchased them. For the reasons discussed on page 61, this form of presentation seems to us to be more useful
to investors and managers than one utilizing generally accepted accounting principles (GAAP), which require purchase-
premiums to be charged off business-by-business. The total earnings we show in the table are, of course, identical to
the GAAP total in our audited financial statements. (in millions)
Berkshire’s Share
of Net Earnings
(after taxes and
Pre-Tax Earnings minority interests)
1999 1998 1999 1998
Operating Earnings:
Insurance Group:
Underwriting — Reinsurance ............... $(1,440) $(21) $(927) $(14)
Underwriting — GEICO ................... 24 269 16 175
Underwriting — Other Primary .............. 22 17 14 10
Net Investment Income .................... 2,482 974 1,764 731
Buffalo News ............................. 55 53 34 32
Finance and Financial Products Businesses ...... 125 205 86 133
Flight Services ............................ 225 181 132 110
(1) (1)
Home Furnishings ......................... 79 72 46 41
(2) (2)
International Dairy Queen ................... 56 58 35 35
Jewelry ................................. 51 39 31 23
Scott Fetzer (excluding finance operation) ....... 147 137 92 85
See’s Candies ............................ 74 62 46 40
Shoe Group .............................. 17 33 11 23
Purchase-Accounting Adjustments ............ (739) (123) (648) (118)
Interest Expense .........................
(3) (109) (100) (70) (63)
Shareholder-Designated Contributions ......... (17) (17) (11) (11)
Other ................................... 33 60 20 45
(4) (4)
Operating Earnings ......................... 1,085 1,899 671 1,277
Capital Gains from Investments ................ 1,365 2,415 886 1,553
Total Earnings - All Entities ............... $2,450 $4,314 $1,557 $ 2,830
Includes Executive Jet from August 7, 1998 . Excludes interest expense of Finance Businesses.
(1) (3)
Includes Jordan’s Furniture from November 13, 1999. Includes General Re operations for ten days in 1998.
(2) (4)