Berkshire Hathaway 1999 Annual Report Download - page 50
Download and view the complete annual report
Please find page 50 of the 1999 Berkshire Hathaway annual report below. You can navigate through the pages in the report by either clicking on the pages listed below, or by using the keyword search tool below to find specific information within the annual report.-
 1
1 -
2
-
3
-
4
-
5
-
6
-
7
-
8
-
9
-
10
-
11
-
12
-
13
-
14
-
15
-
16
-
17
-
18
-
19
-
20
-
21
-
22
-
23
-
24
-
25
-
26
-
27
-
28
-
29
-
30
-
31
-
32
-
33
-
34
-
35
-
36
-
37
-
38
-
39
-
 40
40 -
 41
41 -
 42
42 -
 43
43 -
 44
44 -
 45
45 -
 46
46 -
 47
47 -
 48
48 -
 49
49 -
 50
50 -
 51
51 -
 52
52 -
 53
53 -
 54
54 -
 55
55 -
 56
56 -
 57
57 -
 58
58 -
 59
59 -
 60
60 -
61
-
62
-
63
-
64
-
65
-
66
-
67
-
68
-
69
-
70
-
71
-
72
-
73
-
74
 |
 |

49
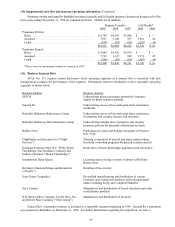
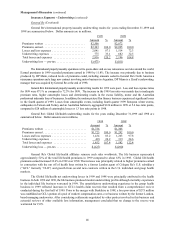
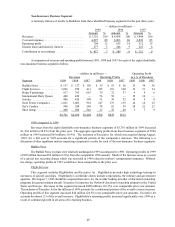
Non-Insurance Business Segments
A summary follows of results to Berkshire from these identified business segments for the past three years.
— (dollars in millions) —
1999 1998 1997
Amount %Amount %Amount %
Revenues ................................. $ 5,701 100 $ 4,438 100 $ 3,404 100
Cost and expenses .......................... 4,997 88 3,803 86 2,892 85
Operating profit ............................ 704 12 635 14 512 15
Income taxes and minority interest ............. 277 5 246 5 201 6
Contribution to net earnings .................. $ 427 7 $ 389 9 $ 311 9
A comparison of revenues and operating profits between 1999, 1998 and 1997 for each of the eight identifiable
non-insurance business segments follows.
— (dollars in millions) — Operating Profit
Revenues Operating Profits as a % of Revenues
Segment 1999 1998 1997 1999 1998 1997 1999 1998 1997
Buffalo News ........... $ 157 $ 157 $ 156 $ 55 $ 53 $ 56 35 34 36
Flight Services .......... 1,856 858 411 225 181 140 12 21 34
Home Furnishings ....... 917 793 667 79 72 57 9 9 9
International Dairy Queen 460 420 — 56 58 — 12 14 —
Jewelry ............... 486 420 398 51 39 32 10 9 8
Scott Fetzer Companies ... 1,021 1,002 961 147 137 119 14 14 12
See’s Candies .......... 306 288 269 74 62 59 24 22 22
Shoe Group ............ 498 500 542 17 33 49 3 7 9
$5,701 $4,438 $3,404 $704 $635 $512
1999 compared to 1998
Revenues from the eight identifiable non-insurance business segments of $5,701 million in 1999 increased
$1,263 million (28.5%) from the prior year. The aggregate operating profits from these business segments of $704
million in 1999 increased $69 million (10.9%). The inclusion of Executive Jet, which was acquired during August,
1998, for a full year in 1999 accounts for a significant portion of the comparative increases. The following is a
discussion of other significant matters impacting comparative results for each of the non-insurance business segments.
Buffalo News
The Buffalo News revenues were relatively unchanged in 1999 as compared to 1998. Operating profits in 1999
of $55 million increased $2 million (3.8%) from the comparable 1998 amount. Much of the increase arose as a result
of a special non recurring charge which was recorded in 1998 related to workers’ compensation insurance. Without
the charge, operating profits in 1999 would have been comparable to the prior year.
Flight Services
This segment includes FlightSafety and Executive Jet. FlightSafety provides high technology training to
operators of aircraft and ships. FlightSafety’s worldwide clients include corporations, the military and governmen t
agencies. On August 7, 1998, Berkshire acquired Executive Jet, the worlds’ leading provider of fractional ownership
programs for general aviation aircraft. Executive Jet operates the NetJets® fractional ownership program in the United
States and Europe. Revenues of this segment increased $998 million (116.3%) over comparable prior year amounts.
The inclusion of Executive Jet for the full year of 1999 accounts for a substantial portion of the overall revenue increase.
Operating profits of this segment increased $44 million (24.3%) over comparable prior year amounts. Executive Jet
accounts for almost 2/3 of the overall increase. FlightSafety’s operating profits increased significantly over 1998 as a
result of continued growth in all areas of its training business.