Berkshire Hathaway 1999 Annual Report Download - page 21
Download and view the complete annual report
Please find page 21 of the 1999 Berkshire Hathaway annual report below. You can navigate through the pages in the report by either clicking on the pages listed below, or by using the keyword search tool below to find specific information within the annual report.-
 1
1 -
2
-
3
-
4
-
5
-
6
-
7
-
8
-
9
-
10
-
 11
11 -
 12
12 -
 13
13 -
 14
14 -
 15
15 -
 16
16 -
 17
17 -
 18
18 -
 19
19 -
 20
20 -
 21
21 -
 22
22 -
 23
23 -
 24
24 -
 25
25 -
 26
26 -
 27
27 -
 28
28 -
 29
29 -
 30
30 -
 31
31 -
32
-
33
-
34
-
35
-
36
-
37
-
38
-
39
-
40
-
41
-
42
-
43
-
44
-
45
-
46
-
47
-
48
-
49
-
50
-
51
-
52
-
53
-
54
-
55
-
56
-
57
-
58
-
59
-
60
-
61
-
62
-
63
-
64
-
65
-
66
-
67
-
68
-
69
-
70
-
71
-
72
-
73
-
74
 |
 |

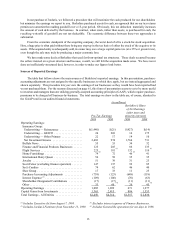
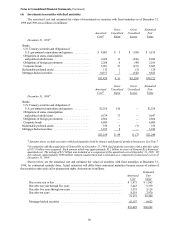
20
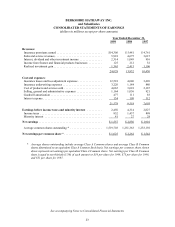
BERKSHIRE HATHAWAY INC.
Selected Financial Data for the Past Five Years
(dollars in millions, except per share data)
1999 1998 1997 1996 1995
Revenues:
Insurance premiums earned .................. $14,306 $ 5,481 $ 4,761 $ 4,118 $ 957
Sales and service revenues ................... 5,918 4,675 3,615 3,095 2,756
Interest, dividend and other investment income .... 2,314 1,049 916 778 629
Income from finance and financial products
businesses .............................. 125 212 32 25 27
Realized investment gain ...................
(1) 1,365 2,415 1,106 2,484 194
(2) (3)
Total revenues ............................ $24,028 $13,832 $10,430 $10,500 $ 4,563
Earnings:
Before realized investment gain .............. $ 671 $ 1,277 $ 1,197 $ 884 $670
Realized investment gain ..................
(1) 886 1,553 704 1,605 125
(2) (3)
Net earnings ............................. $ 1,557 $ 2,830 $ 1,901 $ 2,489 $795
Earnings per share:
Before realized investment gain .............. $ 442 $ 1,021 $ 971 $ 733 $565
Realized investment gain ..................
(1) 583 1,241 571 1,332 105
(2) (3)
Net earnings ............................. $ 1,025 $ 2,262 $ 1,542 $ 2,065 $670
Year-end data :
(4)
Total assets ............................. $131,416 $122,237 $56,111 $43,409 $28,711
Borrowings under investment agreements
and other debt .......................
(5) 2,465 2,385 2,267 1,944 1,062
Shareholders’ equity ...................... 57,761 57,403 31,455 23,427 16,739
Class A equivalent common shares
outstanding, in thousands ................ 1,521 1,519 1,234 1,232 1,194
Shareholders’ equity per outstanding
Class A equivalent share ................. $ 37,987 $ 37,801 $25,488 $19,011 $14,025
_________________
The amount of realized investment gain/loss for any given period has no predictive value, and variations in amount
(1)
from period to period have no practical analytical value, particularly in view of the unrealized appreciation now
existing in Berkshire's consolidated investment portfolio.
In November 1997, Travelers Group Inc. completed its acquisition of Salomon Inc. A pre-tax realized gain of $678
(2)
million ($427 million after-tax) is included in 1997's results.
In March 1996, The Walt Disney Company completed its acquisition of Capital Cities/ABC, Inc. A pre-tax realized
(3)
gain related to this transaction of $2.2 billion ($1.4 billion after-tax) is included in 1996's results.
Year-end data for 1998 includes General Re Corporation acquired by Berkshire on December 21, 1998.
(4)
Excludes borrowings of finance businesses.
(5)