Berkshire Hathaway 1999 Annual Report Download - page 43
Download and view the complete annual report
Please find page 43 of the 1999 Berkshire Hathaway annual report below. You can navigate through the pages in the report by either clicking on the pages listed below, or by using the keyword search tool below to find specific information within the annual report.-
 1
1 -
2
-
3
-
4
-
5
-
6
-
7
-
8
-
9
-
10
-
11
-
12
-
13
-
14
-
15
-
16
-
17
-
18
-
19
-
20
-
21
-
22
-
23
-
24
-
25
-
26
-
27
-
28
-
29
-
30
-
31
-
32
-
 33
33 -
 34
34 -
 35
35 -
 36
36 -
 37
37 -
 38
38 -
 39
39 -
 40
40 -
 41
41 -
 42
42 -
 43
43 -
 44
44 -
 45
45 -
 46
46 -
 47
47 -
 48
48 -
 49
49 -
 50
50 -
 51
51 -
 52
52 -
 53
53 -
54
-
55
-
56
-
57
-
58
-
59
-
60
-
61
-
62
-
63
-
64
-
65
-
66
-
67
-
68
-
69
-
70
-
71
-
72
-
73
-
74
 |
 |

42
Notes to Consolidated Financial Statements (Continued)
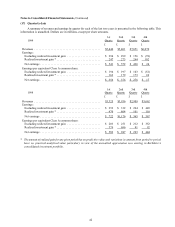
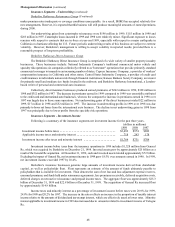
(17) Quarterly data
A summary of revenues and earnings by quarter for each of the last two years is presented in the following table. This
information is unaudited. Dollars are in millions, except per share amounts.
1st 2nd 3rd 4th
1999 Quarte Quarte Quarte Quarte
r r r r
Revenues ............................................ $5,446 $5,461 $7,051 $6,070
Earnings:
Excluding realized investment gain ...................... $ 294 $ 299 $ 156 $ (78)
Realized investment gain * ............................. 247 273 264 102
Net earnings ........................................ $ 541 $ 572 $ 420 $ 24
Earnings per equivalent Class A common share:
Excluding realized investment gain ...................... $ 194 $ 197 $ 103 $ (52)
Realized investment gain * ............................. 162 179 173 69
Net earnings ........................................ $ 356 $ 376 $ 276 $ 17
1st 2nd 3rd 4th
1998 Quarte Quarte Quarte Quarte
r r r r
Revenues ............................................ $3,325 $3,936 $2,909 $3,662
Earnings:
Excluding realized investment gain ...................... $ 252 $ 312 $ 264 $ 449
Realized investment gain * ............................. 470 864 101 118
Net earnings ........................................ $ 722 $1,176 $ 365 $ 567
Earnings per equivalent Class A common share:
Excluding realized investment gain ...................... $ 203 $ 251 $ 212 $ 352
Realized investment gain * ............................. 379 696 81 92
Net earnings ........................................ $ 582 $ 947 $ 293 $ 444
*The amount of realized gain for any given period has no predictive value and variations in amount from period to period
have no practical analytical value particulary in view of the unrealized appreciation now existing in Berkshire’s
consolidated investment portfolio.