Berkshire Hathaway 1999 Annual Report Download - page 5
Download and view the complete annual report
Please find page 5 of the 1999 Berkshire Hathaway annual report below. You can navigate through the pages in the report by either clicking on the pages listed below, or by using the keyword search tool below to find specific information within the annual report.-
 1
1 -
 2
2 -
 3
3 -
 4
4 -
 5
5 -
 6
6 -
 7
7 -
 8
8 -
 9
9 -
 10
10 -
 11
11 -
 12
12 -
 13
13 -
 14
14 -
 15
15 -
 16
16 -
17
-
18
-
19
-
20
-
21
-
22
-
23
-
24
-
25
-
26
-
27
-
28
-
29
-
30
-
31
-
32
-
33
-
34
-
35
-
36
-
37
-
38
-
39
-
40
-
41
-
42
-
43
-
44
-
45
-
46
-
47
-
48
-
49
-
50
-
51
-
52
-
53
-
54
-
55
-
56
-
57
-
58
-
59
-
60
-
61
-
62
-
63
-
64
-
65
-
66
-
67
-
68
-
69
-
70
-
71
-
72
-
73
-
74
 |
 |

4
Guides to Intrinsic Value
I often talk in these pages about intrinsic value, a key, though far from precise, measurement we utilize in our
acquisitions of businesses and common stocks. (For an extensive discussion of this, and other investment and
accounting terms and concepts, please refer to our Owner’s Manual on pages 55 - 62. Intrinsic value is discussed on
page 60.)
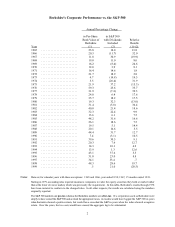
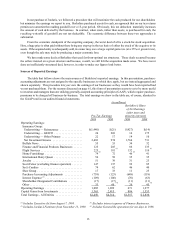
In our last four reports, we have furnished you a table that we regard as useful in estimating Berkshire’ s
intrinsic value. In the updated version of that table, which follows, we trace two key components of value. The first
column lists our per-share ownership of investments (including cash and equivalents but excluding assets held in our
financial products operation) and the second column shows our per-share earnings from Berkshire’s operatin g
businesses before taxes and purchase-accounting adjustments (discussed on page 61), but after all interest and corporate
expenses. The second column excludes all dividends, interest and capital gains that we realized from the investments
presented in the first column. In effect, the columns show how Berkshire would look if it were split into two parts, with
one entity holding our investments and the other operating all of our businesses and bearing all corporate costs.
Pre-tax Earnings
(Loss) Per Share
Investments With All Income from
Year Per Share Investments Excluded
1969 ............................................ $ 45 $ 4.39
1979 ............................................ 577 13.07
1989 ............................................ 7,200 108.86
1999 ............................................ 47,339 (458.55)
Here are the growth rates of the two segments by decade:
Pre-tax Earnings Per Share
Investments With All Income from
Decade Ending Per Share Investments Excluded
1979 ........................................... 29.0% 11.5%
1989 ........................................... 28.7% 23.6%
1999 ........................................... 20.7% N.A.
Annual Growth Rate, 1969-1999 ...................... 25.4% N.A.
In 1999, our per-share investments changed very little, but our operating earnings, affected by negatives that
overwhelmed some strong positives, fell apart. Most of our operating managers deserve a grade of A for delivering
fine results and for having widened the difference between the intrinsic value of their businesses and the value at which
these are carried on our balance sheet. But, offsetting this, we had a huge — and, I believe, aberrational —
underwriting loss at General Re. Additionally, GEICO’s underwriting profit fell, as we had predicted it would .
GEICO’s overall performance, though, was terrific, outstripping my ambitious goals.
We do not expect our underwriting earnings to improve in any dramatic way this year. Though GEICO’ s
intrinsic value should grow by a highly satisfying amount, its underwriting performance is almost certain to weaken.
That’s because auto insurers, as a group, will do worse in 2000, and because we will materially increase our marketing
expenditures. At General Re, we are raising rates and, if there is no mega-catastrophe in 2000, the company’ s
underwriting loss should fall considerably. It takes some time, however, for the full effect of rate increases to kick in,
and General Re is therefore likely to have another unsatisfactory underwriting year.