BP 2010 Annual Report Download - page 55
Download and view the complete annual report
Please find page 55 of the 2010 BP annual report below. You can navigate through the pages in the report by either clicking on the pages listed below, or by using the keyword search tool below to find specific information within the annual report.-
 1
1 -
2
-
3
-
4
-
5
-
6
-
7
-
8
-
9
-
10
-
11
-
12
-
13
-
14
-
15
-
16
-
17
-
18
-
19
-
20
-
21
-
22
-
23
-
24
-
25
-
26
-
27
-
28
-
29
-
30
-
31
-
32
-
33
-
34
-
35
-
36
-
37
-
38
-
39
-
40
-
41
-
42
-
43
-
44
-
 45
45 -
 46
46 -
 47
47 -
 48
48 -
 49
49 -
 50
50 -
 51
51 -
 52
52 -
 53
53 -
 54
54 -
 55
55 -
 56
56 -
 57
57 -
 58
58 -
 59
59 -
 60
60 -
 61
61 -
 62
62 -
 63
63 -
 64
64 -
 65
65 -
66
-
67
-
68
-
69
-
70
-
71
-
72
-
73
-
74
-
75
-
76
-
77
-
78
-
79
-
80
-
81
-
82
-
83
-
84
-
85
-
86
-
87
-
88
-
89
-
90
-
91
-
92
-
93
-
94
-
95
-
96
-
97
-
98
-
99
-
100
-
101
-
102
-
103
-
104
-
105
-
106
-
107
-
108
-
109
-
110
-
111
-
112
-
113
-
114
-
115
-
116
-
117
-
118
-
119
-
120
-
121
-
122
-
123
-
124
-
125
-
126
-
127
-
128
-
129
-
130
-
131
-
132
-
133
-
134
-
135
-
136
-
137
-
138
-
139
-
140
-
141
-
142
-
143
-
144
-
145
-
146
-
147
-
148
-
149
-
150
-
151
-
152
-
153
-
154
-
155
-
156
-
157
-
158
-
159
-
160
-
161
-
162
-
163
-
164
-
165
-
166
-
167
-
168
-
169
-
170
-
171
-
172
-
173
-
174
-
175
-
176
-
177
-
178
-
179
-
180
-
181
-
182
-
183
-
184
-
185
-
186
-
187
-
188
-
189
-
190
-
191
-
192
-
193
-
194
-
195
-
196
-
197
-
198
-
199
-
200
-
201
-
202
-
203
-
204
-
205
-
206
-
207
-
208
-
209
-
210
-
211
-
212
-
213
-
214
-
215
-
216
-
217
-
218
-
219
-
220
-
221
-
222
-
223
-
224
-
225
-
226
-
227
-
228
-
229
-
230
-
231
-
232
-
233
-
234
-
235
-
236
-
237
-
238
-
239
-
240
-
241
-
242
-
243
-
244
-
245
-
246
-
247
-
248
-
249
-
250
-
251
-
252
-
253
-
254
-
255
-
256
-
257
-
258
-
259
-
260
-
261
-
262
-
263
-
264
-
265
-
266
-
267
-
268
-
269
-
270
-
271
-
272
 |
 |

Business review
Business review
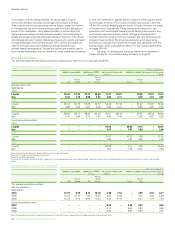
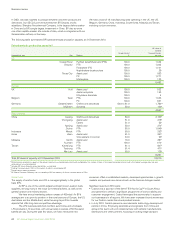
thousand barrels per day
Subsidiaries BP net share of productiona
Field or area 2010 2009 2008
UKb ETAPc 28 34 27
Foinavend 24 29 26
Other 85 105 120
Total UK 137 168 173
Norwayb Various 40 40 43
Total Rest of Europe 40 40 43
Total Europe 177 208 216
Alaska Prudhoe Bayd 67 69 72
Kuparuk 42 45 48
Milne Pointd 23 24 27
Other 34 43 50
Total Alaska 166 181 197
Lower 48 onshoreb Various 90 97 97
Gulf of Mexico deepwaterb Thunder Horsed 120 133 24
Atlantisd 49 54 42
Mad Dogd 30 35 31
Mars 23 29 28
Na Kikad 25 27 29
Horn Mountaind 14 25 18
Kingd 21 22 23
Other 56 62 49
Total Gulf of Mexico deepwater 338 387 244
Total US 594 665 538
Canadab Variousd 7 8 9
Total Rest of North America 7 8 9
Total North America 601 673 547
Colombia Variousd 18 23 24
Trinidad & Tobago Variousd 36 38 38
Venezuelab Various – – 4
Total South America 54 61 66
Angola Greater Plutoniod 73 70 69
Kizomba C Dev 31 43 30
Dalia 20 32 34
Girassol FPSO 18 22 22
Other 28 44 46
Total Angola 170 211 201
Egyptb Gupco 47 55 41
Other 12 16 16
Total Egypt 59 71 57
Algeria Various 17 22 19
Total Africa 246 304 277
Azerbaijanb Azeri-Chirag-Gunashlid 94 94 97
Other 9 7 8
Total Azerbaijan 103 101 105
Western Indonesiab Various 2 5 7
Other Various 14 17 16
Total Rest of Asiab 119 123 128
Total Asia 119 123 128
Australia Various 30 31 29
Other Various 2 – –
Total Australasia 32 31 29
Total subsidiariese 1,229 1,400 1,263
Equity-accounted entities (BP share)
Russia – TNK-BPb Various 856 840 826
Total Russia 856 840 826
Abu Dhabif Various 190 182 210
Other Various 1 12 10
Total Rest of Asiab 191 194 220
Total Asia 1,047 1,034 1,046
Argentina Various 75 75 70
Venezuelab Various 23 25 19
Boliviab Various – 1 3
Total South America 98 101 92
Total equity-accounted entities 1,145 1,135 1,138
Total subsidiaries and equity-accounted entities 2,374 2,535 2,401
a
P roduction excludes royalties due to others whether payable in cash or in kind where the royalty owner has a direct interest in the underlying production and the option and ability to make lifting and
sales arrangements independently.
b
In
2010, BP divested its Permian Basin assets in Texas and south-east New Mexico, the East Badr El-Din and Western Desert concession in Egypt, its Canada gas assets and reduced its interest in the
Tubular Bells and King fields in the Gulf of Mexico. It also acquired an increased holding in the Azeri-Chirag-Gunashli development in Azerbaijan and the Valhall and Hod fields in the Norwegian North
Sea. Four other producing fields in the Gulf of Mexico that were acquired during 2010 were subsequently disposed of in early 2011. In 2009, BP assumed operatorship of the Mirpurkhas and Khipro
blocks in Pakistan, swapped a number of assets with BG Group plc in the UK sector of the North Sea, divested some minor interests in the US Lower 48, divested its holdings in Indonesia’s Offshore
Northwest Java to Pertamina, divested its interests in LukArco to Lukoil and the Bolivian government nationalized, with compensation payable, Pan American Energy’s shares of Chaco. In 2008, BP
concluded the migration of the Cerro Negro operations to an incorporated joint venture with PDVSA while retaining its equity position, and TNK-BP disposed of some non-core interests.
c V
olumes relate to six BP-operated fields within ETAP. BP has no interests in the remaining three ETAP fields, which are operated by Shell.
d BP -operated.
e Includes 29 net mboe/d of NGLs from processing plants in which BP has an interest (2009 26mboe/d and 2008 19mboe/d).
f T he BP group holds interests, through associates, in onshore and offshore concessions in Abu Dhabi, expiring in 2014 and 2018 respectively.
www.bp.com/downloads/oilandgasproduction
BP’s net production by major field for 2010, 2009 and 2008.
Liquids
BP Annual Report and Form 20-F 2010 53