BP 2010 Annual Report Download - page 28
Download and view the complete annual report
Please find page 28 of the 2010 BP annual report below. You can navigate through the pages in the report by either clicking on the pages listed below, or by using the keyword search tool below to find specific information within the annual report.-
 1
1 -
2
-
3
-
4
-
5
-
6
-
7
-
8
-
9
-
10
-
11
-
12
-
13
-
14
-
15
-
16
-
17
-
 18
18 -
 19
19 -
 20
20 -
 21
21 -
 22
22 -
 23
23 -
 24
24 -
 25
25 -
 26
26 -
 27
27 -
 28
28 -
 29
29 -
 30
30 -
 31
31 -
 32
32 -
 33
33 -
 34
34 -
 35
35 -
 36
36 -
 37
37 -
 38
38 -
39
-
40
-
41
-
42
-
43
-
44
-
45
-
46
-
47
-
48
-
49
-
50
-
51
-
52
-
53
-
54
-
55
-
56
-
57
-
58
-
59
-
60
-
61
-
62
-
63
-
64
-
65
-
66
-
67
-
68
-
69
-
70
-
71
-
72
-
73
-
74
-
75
-
76
-
77
-
78
-
79
-
80
-
81
-
82
-
83
-
84
-
85
-
86
-
87
-
88
-
89
-
90
-
91
-
92
-
93
-
94
-
95
-
96
-
97
-
98
-
99
-
100
-
101
-
102
-
103
-
104
-
105
-
106
-
107
-
108
-
109
-
110
-
111
-
112
-
113
-
114
-
115
-
116
-
117
-
118
-
119
-
120
-
121
-
122
-
123
-
124
-
125
-
126
-
127
-
128
-
129
-
130
-
131
-
132
-
133
-
134
-
135
-
136
-
137
-
138
-
139
-
140
-
141
-
142
-
143
-
144
-
145
-
146
-
147
-
148
-
149
-
150
-
151
-
152
-
153
-
154
-
155
-
156
-
157
-
158
-
159
-
160
-
161
-
162
-
163
-
164
-
165
-
166
-
167
-
168
-
169
-
170
-
171
-
172
-
173
-
174
-
175
-
176
-
177
-
178
-
179
-
180
-
181
-
182
-
183
-
184
-
185
-
186
-
187
-
188
-
189
-
190
-
191
-
192
-
193
-
194
-
195
-
196
-
197
-
198
-
199
-
200
-
201
-
202
-
203
-
204
-
205
-
206
-
207
-
208
-
209
-
210
-
211
-
212
-
213
-
214
-
215
-
216
-
217
-
218
-
219
-
220
-
221
-
222
-
223
-
224
-
225
-
226
-
227
-
228
-
229
-
230
-
231
-
232
-
233
-
234
-
235
-
236
-
237
-
238
-
239
-
240
-
241
-
242
-
243
-
244
-
245
-
246
-
247
-
248
-
249
-
250
-
251
-
252
-
253
-
254
-
255
-
256
-
257
-
258
-
259
-
260
-
261
-
262
-
263
-
264
-
265
-
266
-
267
-
268
-
269
-
270
-
271
-
272
 |
 |

Businessreview
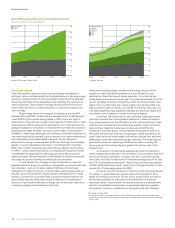
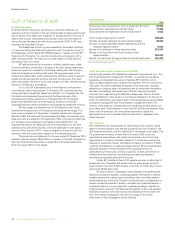
Non-GAAP information on fair value accounting effects
Theimpactsoffairvalueaccountingeffects,relativetomanagement’sinternalmeasureofperformance,andareconciliationtoGAAPinformationisalso
setoutbelow.Furtherinformationonfairvalueaccountingeffectsisprovidedonpage82.
$million
2010 2009 2008
ExplorationandProduction
Unrecognizedgains(losses)broughtforwardfrompreviousperiod (530) 389 107
Unrecognized(gains)lossescarriedforward 527 530 (389)
Favourable(unfavourable)impactrelativetomanagement’smeasureofperformance (3) 919 (282)
ReningandMarketing
Unrecognizedgains(losses)broughtforwardfrompreviousperiod 179 (82) 429
Unrecognized(gains)lossescarriedforward (137) (179) 82
Favourable(unfavourable)impactrelativetomanagement’smeasureofperformance 42 (261) 511
39 658 229
Taxationcredit(charge)a (26) (213) (83)
13 445 146
By region
ExplorationandProduction
US 141 687 (231)
Non-US (144) 232 (51)
(3) 919 (282)
ReningandMarketing
US 19 16 231
Non-US 23 (277) 280
42 (261) 511
aTaxiscalculatedbyapplyingdiscretequarterlyeffectivetaxrates(excludingtheimpactoftheGulfofMexicooilspill)ongroupprotorloss,tothefairvalueaccountingeffectsastheyariseeachquarter.
Reconciliation of non-GAAP information
$million
2010 2009 2008
ExplorationandProduction
Replacementcostprotbeforeinterestandtaxadjustedforfairvalueaccountingeffects 30,889 23,881 38,590
Impactoffairvalueaccountingeffects (3) 919 (282)
Replacementcostprotbeforeinterestandtax 30,886 24,800 38,308
ReningandMarketing
Replacementcostprotbeforeinterestandtaxadjustedforfairvalueaccountingeffects 5,513 1,004 3,665
Impactoffairvalueaccountingeffects 42 (261) 511
Replacementcostprotbeforeinterestandtax 5,555 743 4,176
26BPAnnualReportandForm20-F2010