BP 2010 Annual Report Download - page 215
Download and view the complete annual report
Please find page 215 of the 2010 BP annual report below. You can navigate through the pages in the report by either clicking on the pages listed below, or by using the keyword search tool below to find specific information within the annual report.-
 1
1 -
2
-
3
-
4
-
5
-
6
-
7
-
8
-
9
-
10
-
11
-
12
-
13
-
14
-
15
-
16
-
17
-
18
-
19
-
20
-
21
-
22
-
23
-
24
-
25
-
26
-
27
-
28
-
29
-
30
-
31
-
32
-
33
-
34
-
35
-
36
-
37
-
38
-
39
-
40
-
41
-
42
-
43
-
44
-
45
-
46
-
47
-
48
-
49
-
50
-
51
-
52
-
53
-
54
-
55
-
56
-
57
-
58
-
59
-
60
-
61
-
62
-
63
-
64
-
65
-
66
-
67
-
68
-
69
-
70
-
71
-
72
-
73
-
74
-
75
-
76
-
77
-
78
-
79
-
80
-
81
-
82
-
83
-
84
-
85
-
86
-
87
-
88
-
89
-
90
-
91
-
92
-
93
-
94
-
95
-
96
-
97
-
98
-
99
-
100
-
101
-
102
-
103
-
104
-
105
-
106
-
107
-
108
-
109
-
110
-
111
-
112
-
113
-
114
-
115
-
116
-
117
-
118
-
119
-
120
-
121
-
122
-
123
-
124
-
125
-
126
-
127
-
128
-
129
-
130
-
131
-
132
-
133
-
134
-
135
-
136
-
137
-
138
-
139
-
140
-
141
-
142
-
143
-
144
-
145
-
146
-
147
-
148
-
149
-
150
-
151
-
152
-
153
-
154
-
155
-
156
-
157
-
158
-
159
-
160
-
161
-
162
-
163
-
164
-
165
-
166
-
167
-
168
-
169
-
170
-
171
-
172
-
173
-
174
-
175
-
176
-
177
-
178
-
179
-
180
-
181
-
182
-
183
-
184
-
185
-
186
-
187
-
188
-
189
-
190
-
191
-
192
-
193
-
194
-
195
-
196
-
197
-
198
-
199
-
200
-
201
-
202
-
203
-
204
-
 205
205 -
 206
206 -
 207
207 -
 208
208 -
 209
209 -
 210
210 -
 211
211 -
 212
212 -
 213
213 -
 214
214 -
 215
215 -
 216
216 -
 217
217 -
 218
218 -
 219
219 -
 220
220 -
 221
221 -
 222
222 -
 223
223 -
 224
224 -
 225
225 -
226
-
227
-
228
-
229
-
230
-
231
-
232
-
233
-
234
-
235
-
236
-
237
-
238
-
239
-
240
-
241
-
242
-
243
-
244
-
245
-
246
-
247
-
248
-
249
-
250
-
251
-
252
-
253
-
254
-
255
-
256
-
257
-
258
-
259
-
260
-
261
-
262
-
263
-
264
-
265
-
266
-
267
-
268
-
269
-
270
-
271
-
272
 |
 |

Notes on financial statements
Financial statements
40. Capital and reserves continued
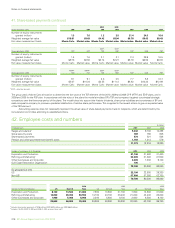
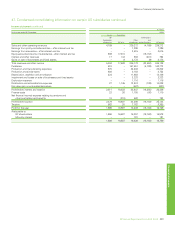
The pre-tax amounts of each component of other comprehensive income, and the related amounts of tax, are shown in the table below.
$ million
2010
Pre-tax Tax Net of tax
Currency translation differences (including recycling) 239 (108) 131
Actuarial loss relating to pensions and other post-retirement benefits (320) (98) (418)
Available-for-sale investments (including recycling) (341) 50 (291)
Cash flow hedges (including recycling) (37) 19 (18)
Other comprehensive income (459) (137) (596)
$ million
2009
Pre-tax Tax Net of tax
Currency translation differences (including recycling) 1,799 564 2,363
Actuarial loss relating to pensions and other post-retirement benefits (682) 204 (478)
Available-for-sale investments (including recycling) 707 (14) 693
Cash flow hedges (including recycling) 1,154 (229) 925
Other comprehensive income 2,978 525 3,503
$ million
2008
Pre-tax Tax Net of tax
Currency translation differences (including recycling) (4,362) 100 (4,262)
Actuarial loss relating to pensions and other post-retirement benefits (8,430) 2,602 (5,828)
Available-for-sale investments (including recycling) (468) 50 (418)
Cash flow hedges (including recycling) (1,166) 194 (972)
Other comprehensive income (14,426) 2,946 (11,480)
BP Annual Report and Form 20-F 2010 213