BP 2010 Annual Report Download - page 19
Download and view the complete annual report
Please find page 19 of the 2010 BP annual report below. You can navigate through the pages in the report by either clicking on the pages listed below, or by using the keyword search tool below to find specific information within the annual report.-
 1
1 -
2
-
3
-
4
-
5
-
6
-
7
-
8
-
 9
9 -
 10
10 -
 11
11 -
 12
12 -
 13
13 -
 14
14 -
 15
15 -
 16
16 -
 17
17 -
 18
18 -
 19
19 -
 20
20 -
 21
21 -
 22
22 -
 23
23 -
 24
24 -
 25
25 -
 26
26 -
 27
27 -
 28
28 -
 29
29 -
30
-
31
-
32
-
33
-
34
-
35
-
36
-
37
-
38
-
39
-
40
-
41
-
42
-
43
-
44
-
45
-
46
-
47
-
48
-
49
-
50
-
51
-
52
-
53
-
54
-
55
-
56
-
57
-
58
-
59
-
60
-
61
-
62
-
63
-
64
-
65
-
66
-
67
-
68
-
69
-
70
-
71
-
72
-
73
-
74
-
75
-
76
-
77
-
78
-
79
-
80
-
81
-
82
-
83
-
84
-
85
-
86
-
87
-
88
-
89
-
90
-
91
-
92
-
93
-
94
-
95
-
96
-
97
-
98
-
99
-
100
-
101
-
102
-
103
-
104
-
105
-
106
-
107
-
108
-
109
-
110
-
111
-
112
-
113
-
114
-
115
-
116
-
117
-
118
-
119
-
120
-
121
-
122
-
123
-
124
-
125
-
126
-
127
-
128
-
129
-
130
-
131
-
132
-
133
-
134
-
135
-
136
-
137
-
138
-
139
-
140
-
141
-
142
-
143
-
144
-
145
-
146
-
147
-
148
-
149
-
150
-
151
-
152
-
153
-
154
-
155
-
156
-
157
-
158
-
159
-
160
-
161
-
162
-
163
-
164
-
165
-
166
-
167
-
168
-
169
-
170
-
171
-
172
-
173
-
174
-
175
-
176
-
177
-
178
-
179
-
180
-
181
-
182
-
183
-
184
-
185
-
186
-
187
-
188
-
189
-
190
-
191
-
192
-
193
-
194
-
195
-
196
-
197
-
198
-
199
-
200
-
201
-
202
-
203
-
204
-
205
-
206
-
207
-
208
-
209
-
210
-
211
-
212
-
213
-
214
-
215
-
216
-
217
-
218
-
219
-
220
-
221
-
222
-
223
-
224
-
225
-
226
-
227
-
228
-
229
-
230
-
231
-
232
-
233
-
234
-
235
-
236
-
237
-
238
-
239
-
240
-
241
-
242
-
243
-
244
-
245
-
246
-
247
-
248
-
249
-
250
-
251
-
252
-
253
-
254
-
255
-
256
-
257
-
258
-
259
-
260
-
261
-
262
-
263
-
264
-
265
-
266
-
267
-
268
-
269
-
270
-
271
-
272
 |
 |

Businessreview
Business review
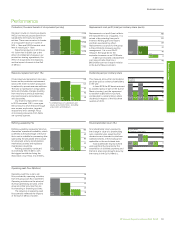
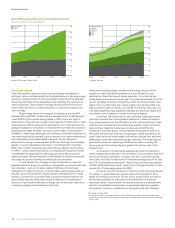
Natural gas prices
Naturalgaspricesstrengthenedin2010,butwerevolatile.TheaverageUS
HenryHubFirstofMonthIndexroseto$4.39/mmBtu,a10%increaseon
thedepressedpricesin2009.
Gasconsumptionrecoveredacrosstheworldalongwiththe
economy.IntheUS,acoldstartin2010,followedbyahotsummerand
lowtemperaturestowardstheendoftheyearalsocontributedtodemand
strength.Yetdomesticproductiongrowth–ofshalegasinparticular–
continuedapaceandlimitedpricerises.HenryHubgaspricesstayed
belowcoalparityinUSpowergenerationfromthesummer,leadingtothe
displacementofcoalbygas.Thedifferentialsofproductionareapricesto
HenryHubpricescontinuedtonarrowaspipelinebottleneckswere
reduced.InEurope,spotgaspricesattheUKNationalBalancingPoint
increasedby38%toanaverageof42.45penceperthermfor2010.Yet
plentifulglobalLNGsupplykeptspotgaspricesbelowoil-indexedcontract
levelsformostoftheyear,causingcompetitionwithcontractpipeline
suppliesandmarginalEuropeangasproduction.UKspotgaspricesonly
attainedcontractpricelevelsinDecemberascoldweathercausedrapid
inventorydraw-downs.
Theriseinpricesfollowedsharpdeclinesin2009.Therecession
andstrongproductionhadcausedtheaverageHenryHubFirstofMonth
Indextofallin2009by56%to$3.99/mmBtu–thelowestlevelsince2002.
IntheUK,NationalBalancingPointpricesaveraged30.85pencepertherm
–47%belowtherecordpricesof58.12penceperthermin2008.
In2011,weexpectgasmarketstocontinuetobedrivenbythe
economy,weather,domesticproductiontrendsandsignicantgrowthof
globalLNGsupply.
Rening margins
Reningmarginswereslightlyhigherin2010asdemandforoilproducts
recoveredstronglyinlinewiththeeconomicbounce-backfromrecession.
Globally,oildemandgrewatthefastestratesince2004.Newrening
capacitycontinuedtocommission,butthestrongdemandrecoverymeant
thatunusedreningcapacityfellforthersttimesince2005.TheBPglobal
indicatorreningmargin(GIM)aaveraged$4.44perbarrel,up44centsper
barrelcomparedwith2009.
MarginsintheFarEastimprovedthemostbutcontinuedto
struggle–averaging$1.63perbarrelinSingaporeasnewreningcapacity
continuedtobeaddedintheregion.Marginsalsoroseinboththe
NorthWestEuropeandtheMediterraneanbutEuropeanmargins
overallremainedwellbelow2008levels.MarginsintheUSwere
relativelyunchanged,upslightlyontheWestandGulfcoastsbutdown
intheMidwest.
Reningmarginsfellsharplyin2009asdemandforoilproducts
collapsedinthewakeoftheglobaleconomicrecessionandasnewrening
capacitycameonstream.Thepremiumforlightproductsabovefueloils
reducedasdemandfortransportfuelsfellalongwiththereductionin
economicactivity,compressingmarginsevenforfullyupgradedreneries.
Lookingahead,renersarelikelytocontinuetooperatewithexcess
capacityglobally,althoughnear-termsupply-demandfundamentalsappear
broadlyinbalance.From2011,wewillbereportinganewreningindicator
margin,replacingtheGIM,whichwecallthereningmarkermargin
(RMM).Thisadoptsabasisthatwebelieveismorecloselyrelatedtothe
approachusedbymanyofourcompetitors.(See Rening and Marketing
on page 55 for further information on RMM.)
a Seefootnoteeonpage56.
BPAnnualReportandForm20-F2010 17