BP 2010 Annual Report Download - page 244
Download and view the complete annual report
Please find page 244 of the 2010 BP annual report below. You can navigate through the pages in the report by either clicking on the pages listed below, or by using the keyword search tool below to find specific information within the annual report.-
 1
1 -
2
-
3
-
4
-
5
-
6
-
7
-
8
-
9
-
10
-
11
-
12
-
13
-
14
-
15
-
16
-
17
-
18
-
19
-
20
-
21
-
22
-
23
-
24
-
25
-
26
-
27
-
28
-
29
-
30
-
31
-
32
-
33
-
34
-
35
-
36
-
37
-
38
-
39
-
40
-
41
-
42
-
43
-
44
-
45
-
46
-
47
-
48
-
49
-
50
-
51
-
52
-
53
-
54
-
55
-
56
-
57
-
58
-
59
-
60
-
61
-
62
-
63
-
64
-
65
-
66
-
67
-
68
-
69
-
70
-
71
-
72
-
73
-
74
-
75
-
76
-
77
-
78
-
79
-
80
-
81
-
82
-
83
-
84
-
85
-
86
-
87
-
88
-
89
-
90
-
91
-
92
-
93
-
94
-
95
-
96
-
97
-
98
-
99
-
100
-
101
-
102
-
103
-
104
-
105
-
106
-
107
-
108
-
109
-
110
-
111
-
112
-
113
-
114
-
115
-
116
-
117
-
118
-
119
-
120
-
121
-
122
-
123
-
124
-
125
-
126
-
127
-
128
-
129
-
130
-
131
-
132
-
133
-
134
-
135
-
136
-
137
-
138
-
139
-
140
-
141
-
142
-
143
-
144
-
145
-
146
-
147
-
148
-
149
-
150
-
151
-
152
-
153
-
154
-
155
-
156
-
157
-
158
-
159
-
160
-
161
-
162
-
163
-
164
-
165
-
166
-
167
-
168
-
169
-
170
-
171
-
172
-
173
-
174
-
175
-
176
-
177
-
178
-
179
-
180
-
181
-
182
-
183
-
184
-
185
-
186
-
187
-
188
-
189
-
190
-
191
-
192
-
193
-
194
-
195
-
196
-
197
-
198
-
199
-
200
-
201
-
202
-
203
-
204
-
205
-
206
-
207
-
208
-
209
-
210
-
211
-
212
-
213
-
214
-
215
-
216
-
217
-
218
-
219
-
220
-
221
-
222
-
223
-
224
-
225
-
226
-
227
-
228
-
229
-
230
-
231
-
232
-
233
-
 234
234 -
 235
235 -
 236
236 -
 237
237 -
 238
238 -
 239
239 -
 240
240 -
 241
241 -
 242
242 -
 243
243 -
 244
244 -
 245
245 -
 246
246 -
 247
247 -
 248
248 -
 249
249 -
 250
250 -
 251
251 -
 252
252 -
 253
253 -
 254
254 -
255
-
256
-
257
-
258
-
259
-
260
-
261
-
262
-
263
-
264
-
265
-
266
-
267
-
268
-
269
-
270
-
271
-
272
 |
 |

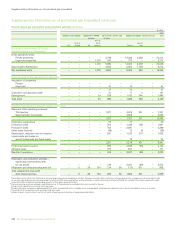
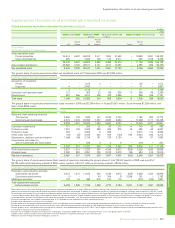
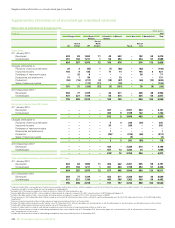
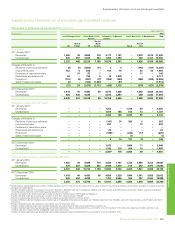
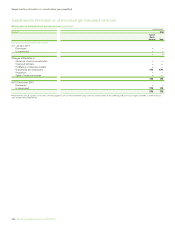
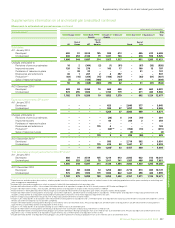
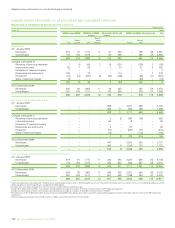
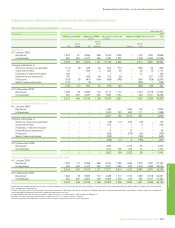
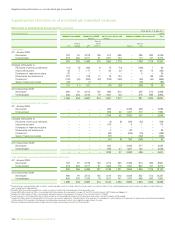
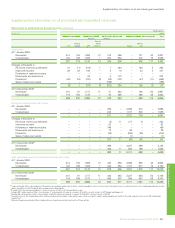
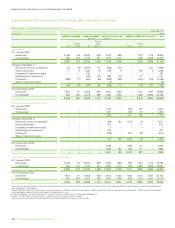
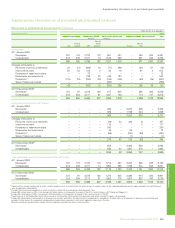
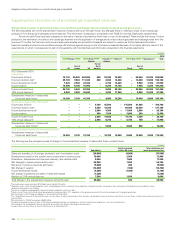
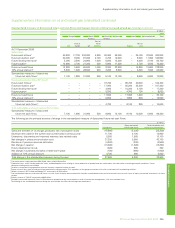
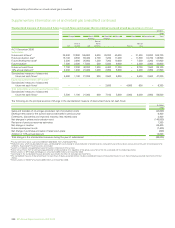
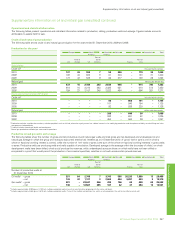
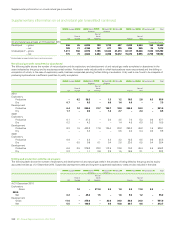
Supplementaryinformationonoilandnaturalgas(unaudited)
Supplementaryinformationonoilandnaturalgas(unaudited)continued
Movements in estimated net proved reserves continued
billioncubicfeet
Natural gasa 2008
Europe North South Africa Asia Australasia Total
America America
Restof
Restof North Restof
UK Europe US America Russia Asia
Subsidiaries
At1January2008
Developed 2,049 63 10,670 608 3,075 990 – 1,270 1,135 19,860
Undeveloped 553 410 4,705 421 7,973 1,410 – 1,269 4,529 21,270
2,602 473 15,375 1,029 11,048 2,400 – 2,539 5,664 41,130
Changesattributableto
Revisionsofpreviousestimates 23 (8) (2,063) 51 (456) 142 – – 361 (1,950)
Improvedrecovery 77 9 1,322 16 159 6 – 108 2 1,699
Purchasesofreserves-in-place – – 183 – – – – – – 183
Discoveriesandextensions – – 549 125 948 82 – 37 – 1,741
Productionb (298) (11) (834) (94) (946) (198) – (274) (140) (2,795)
Salesofreserves-in-place – – – – (3) – – – – (3)
(198) (10) (843) 98 (298) 32 – (129) 223 (1,125)
At31December2008c
Developed 1,822 61 9,059 659 3,316 1,050 – 1,102 1,887 18,956
Undeveloped 582 402 5,473 468 7,434 1,382 – 1,308 4,000 21,049
2,404 463 14,532 1,127 10,750 2,432 – 2,410 5,887 40,005
Equity-accountedentities(BPshare)e
At1January2008
Developed – – – – 1,478 – 808 187 – 2,473
Undeveloped – – – – 831 – 353 113 – 1,297
– – – – 2,309 – 1,161 300 – 3,770
Changesattributableto
Revisionsofpreviousestimates – – – – (96) 182 1,273 (2) – 1,357
Improvedrecovery – – – – 301 – – 11 – 312
Purchasesofreserves-in-place – – – – 3 – – – – 3
Discoveriesandextensions – – – – 192 – – – – 192
Productionb – – – – (188) – (221) (22) – (431)
Salesofreserves-in-place – – – – – – – – – –
– – – – 212 182 1,052 (13) – 1,433
At31December2008d
Developed – – – – 1,498 – 1,560 176 – 3,234
Undeveloped – – – – 1,023 182 653 111 – 1,969
– – – – 2,521 182 2,213 287 – 5,203
Totalsubsidiariesandequity-accountedentities(BPshare)
At1January2008
Developed 2,049 63 10,670 608 4,553 990 808 1,457 1,135 22,333
Undeveloped 553 410 4,705 421 8,804 1,410 353 1,382 4,529 22,567
2,602 473 15,375 1,029 13,357 2,400 1,161 2,839 5,664 44,900
At31December2008
Developed 1,822 61 9,059 659 4,814 1,050 1,560 1,278 1,887 22,190
Undeveloped 582 402 5,473 468 8,457 1,564 653 1,419 4,000 23,018
2,404 463 14,532 1,127 13,271 2,614 2,213 2,697 5,887 45,208
a
Provedreservesexcluderoyaltiesduetoothers,whetherpayableincashorinkind,wheretheroyaltyownerhasadirectinterestintheunderlyingproductionandtheoptionandabilitytomakeliftingand
salesarrangementsindependently.
b
Includes193billioncubicfeetofnaturalgasconsumedinoperations,149billioncubicfeetinsubsidiaries,44billioncubicfeetinequity-accountedentitiesandexcludes17billioncubicfeetofproduced
non-hydrocarboncomponentswhichmeetregulatoryrequirementsforsales.
c
Includes
3,108billioncubicfeetofnaturalgasinrespectofthe30%minorityinterestinBPTrinidadandTobagoLLC.
dIncludes131billioncubicfeetofnaturalgasinrespectofthe5.92%minorityinterestinTNK-BP.
e
Volumesofequity-accountedentitiesincludevolumesofequity-accountedinvestmentsofthoseentities.
242BPAnnualReportandForm20-F2010