BP 2010 Annual Report Download - page 171
Download and view the complete annual report
Please find page 171 of the 2010 BP annual report below. You can navigate through the pages in the report by either clicking on the pages listed below, or by using the keyword search tool below to find specific information within the annual report.-
 1
1 -
2
-
3
-
4
-
5
-
6
-
7
-
8
-
9
-
10
-
11
-
12
-
13
-
14
-
15
-
16
-
17
-
18
-
19
-
20
-
21
-
22
-
23
-
24
-
25
-
26
-
27
-
28
-
29
-
30
-
31
-
32
-
33
-
34
-
35
-
36
-
37
-
38
-
39
-
40
-
41
-
42
-
43
-
44
-
45
-
46
-
47
-
48
-
49
-
50
-
51
-
52
-
53
-
54
-
55
-
56
-
57
-
58
-
59
-
60
-
61
-
62
-
63
-
64
-
65
-
66
-
67
-
68
-
69
-
70
-
71
-
72
-
73
-
74
-
75
-
76
-
77
-
78
-
79
-
80
-
81
-
82
-
83
-
84
-
85
-
86
-
87
-
88
-
89
-
90
-
91
-
92
-
93
-
94
-
95
-
96
-
97
-
98
-
99
-
100
-
101
-
102
-
103
-
104
-
105
-
106
-
107
-
108
-
109
-
110
-
111
-
112
-
113
-
114
-
115
-
116
-
117
-
118
-
119
-
120
-
121
-
122
-
123
-
124
-
125
-
126
-
127
-
128
-
129
-
130
-
131
-
132
-
133
-
134
-
135
-
136
-
137
-
138
-
139
-
140
-
141
-
142
-
143
-
144
-
145
-
146
-
147
-
148
-
149
-
150
-
151
-
152
-
153
-
154
-
155
-
156
-
157
-
158
-
159
-
160
-
 161
161 -
 162
162 -
 163
163 -
 164
164 -
 165
165 -
 166
166 -
 167
167 -
 168
168 -
 169
169 -
 170
170 -
 171
171 -
 172
172 -
 173
173 -
 174
174 -
 175
175 -
 176
176 -
 177
177 -
 178
178 -
 179
179 -
 180
180 -
 181
181 -
182
-
183
-
184
-
185
-
186
-
187
-
188
-
189
-
190
-
191
-
192
-
193
-
194
-
195
-
196
-
197
-
198
-
199
-
200
-
201
-
202
-
203
-
204
-
205
-
206
-
207
-
208
-
209
-
210
-
211
-
212
-
213
-
214
-
215
-
216
-
217
-
218
-
219
-
220
-
221
-
222
-
223
-
224
-
225
-
226
-
227
-
228
-
229
-
230
-
231
-
232
-
233
-
234
-
235
-
236
-
237
-
238
-
239
-
240
-
241
-
242
-
243
-
244
-
245
-
246
-
247
-
248
-
249
-
250
-
251
-
252
-
253
-
254
-
255
-
256
-
257
-
258
-
259
-
260
-
261
-
262
-
263
-
264
-
265
-
266
-
267
-
268
-
269
-
270
-
271
-
272
 |
 |

Notesonnancialstatements
Financial statements
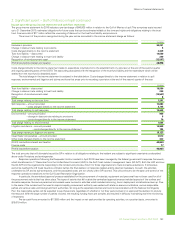
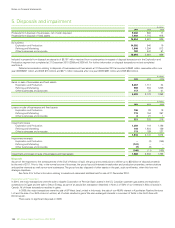
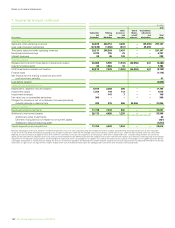
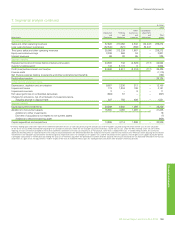
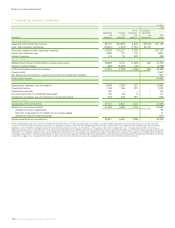
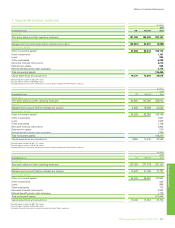
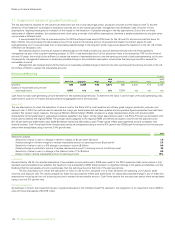
7.Segmentalanalysiscontinued
$million
2009
Other Consolidation
Exploration Rening businesses adjustment
and and and and Total
Bybusiness Production Marketing corporate eliminations group
Segmentrevenues
Salesandotheroperatingrevenues 57,626 213,050 2,843 (34,247) 239,272
Less:salesbetweenbusinesses (32,540) (821) (886) 34,247 –
Thirdpartysalesandotheroperatingrevenues 25,086 212,229 1,957 – 239,272
Equity-accountedearnings 3,309 558 34 – 3,901
Interestrevenues 98 32 95 – 225
Segmentresults
Replacementcostprot(loss)beforeinterestandtaxation 24,800 743 (2,322) (717) 22,504
Inventoryholdinggainsa 142 3,774 6 – 3,922
Prot(loss)beforeinterestandtaxation 24,942 4,517 (2,316) (717) 26,426
Financecosts (1,110)
Netnanceexpenserelatingtopensionsandotherpost-retirementbenets (192)
Protbeforetaxation 25,124
Otherincomestatementitems
Depreciation,depletionandamortization 9,557 2,236 313 – 12,106
Impairmentlosses 118 1,834 189 – 2,141
Impairmentreversals 3 – 8 – 11
Fairvalue(gain)lossonembeddedderivatives (664) 57 – – (607)
Chargesforprovisions,netofwrite-backofunusedprovisions,
includingchangeindiscountrate 307 756 488 – 1,551
Segmentassets
Equity-accountedinvestments 20,289 6,882 1,088 – 28,259
Additionstonon-currentassets 15,855 4,083 1,297 – 21,235
Additionstootherinvestments 19
Elementofacquisitionsnotrelatedtonon-currentassets (7)
Additionstodecommissioningasset (938)
Capitalexpenditureandacquisitions 14,896 4,114 1,299 – 20,309
a
InventoryholdinggainsandlossesrepresentthedifferencebetweenthecostofsalescalculatedusingtheaveragecosttoBPofsuppliesacquiredduringtheperiodandthecostofsalescalculated
ontherst-inrst-out(FIFO)methodafteradjustingforanychangesinprovisionswherethenetrealizablevalueoftheinventoryislowerthanitscost.UndertheFIFOmethod,whichweuseforIFRS
reporting,thecostofinventorychargedtotheincomestatementisbasedonitshistoriccostofpurchase,ormanufacture,ratherthanitsreplacementcost.Involatileenergymarkets,thiscanhavea
signicantdistortingeffectonreportedincome.Theamountsdisclosedrepresentthedifferencebetweenthecharge(totheincomestatement)forinventoryonaFIFObasis(afteradjustingforanyrelated
movementsinnetrealizablevalueprovisions)andthechargethatwouldhavearisenifanaveragecostofsupplieswasusedfortheperiod.Forthispurpose,theaveragecostofsuppliesduringtheperiod
isprincipallycalculatedonamonthlybasisbydividingthetotalcostofinventoryacquiredintheperiodbythenumberofbarrelsacquired.Theamountsdisclosedarenotseparatelyreectedinthenancial
statementsasagainorloss.Noadjustmentismadeinrespectofthecostofinventoriesheldaspartofatradingpositionandcertainothertemporaryinventorypositions.
BPAnnualReportandForm20-F2010 169