BP 2010 Annual Report Download - page 237
Download and view the complete annual report
Please find page 237 of the 2010 BP annual report below. You can navigate through the pages in the report by either clicking on the pages listed below, or by using the keyword search tool below to find specific information within the annual report.-
 1
1 -
2
-
3
-
4
-
5
-
6
-
7
-
8
-
9
-
10
-
11
-
12
-
13
-
14
-
15
-
16
-
17
-
18
-
19
-
20
-
21
-
22
-
23
-
24
-
25
-
26
-
27
-
28
-
29
-
30
-
31
-
32
-
33
-
34
-
35
-
36
-
37
-
38
-
39
-
40
-
41
-
42
-
43
-
44
-
45
-
46
-
47
-
48
-
49
-
50
-
51
-
52
-
53
-
54
-
55
-
56
-
57
-
58
-
59
-
60
-
61
-
62
-
63
-
64
-
65
-
66
-
67
-
68
-
69
-
70
-
71
-
72
-
73
-
74
-
75
-
76
-
77
-
78
-
79
-
80
-
81
-
82
-
83
-
84
-
85
-
86
-
87
-
88
-
89
-
90
-
91
-
92
-
93
-
94
-
95
-
96
-
97
-
98
-
99
-
100
-
101
-
102
-
103
-
104
-
105
-
106
-
107
-
108
-
109
-
110
-
111
-
112
-
113
-
114
-
115
-
116
-
117
-
118
-
119
-
120
-
121
-
122
-
123
-
124
-
125
-
126
-
127
-
128
-
129
-
130
-
131
-
132
-
133
-
134
-
135
-
136
-
137
-
138
-
139
-
140
-
141
-
142
-
143
-
144
-
145
-
146
-
147
-
148
-
149
-
150
-
151
-
152
-
153
-
154
-
155
-
156
-
157
-
158
-
159
-
160
-
161
-
162
-
163
-
164
-
165
-
166
-
167
-
168
-
169
-
170
-
171
-
172
-
173
-
174
-
175
-
176
-
177
-
178
-
179
-
180
-
181
-
182
-
183
-
184
-
185
-
186
-
187
-
188
-
189
-
190
-
191
-
192
-
193
-
194
-
195
-
196
-
197
-
198
-
199
-
200
-
201
-
202
-
203
-
204
-
205
-
206
-
207
-
208
-
209
-
210
-
211
-
212
-
213
-
214
-
215
-
216
-
217
-
218
-
219
-
220
-
221
-
222
-
223
-
224
-
225
-
226
-
 227
227 -
 228
228 -
 229
229 -
 230
230 -
 231
231 -
 232
232 -
 233
233 -
 234
234 -
 235
235 -
 236
236 -
 237
237 -
 238
238 -
 239
239 -
 240
240 -
 241
241 -
 242
242 -
 243
243 -
 244
244 -
 245
245 -
 246
246 -
 247
247 -
248
-
249
-
250
-
251
-
252
-
253
-
254
-
255
-
256
-
257
-
258
-
259
-
260
-
261
-
262
-
263
-
264
-
265
-
266
-
267
-
268
-
269
-
270
-
271
-
272
 |
 |

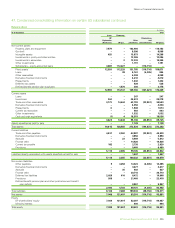
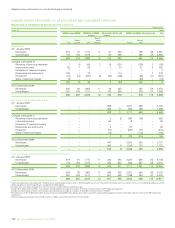
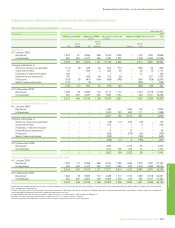
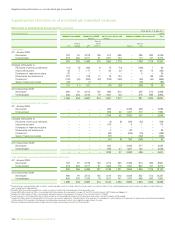
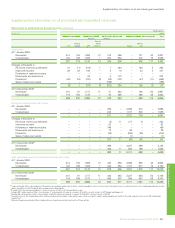
Supplementaryinformationonoilandnaturalgas(unaudited)
Financial statements
Supplementaryinformationonoilandnaturalgas(unaudited)continued
Movements in estimated net proved reserves continued
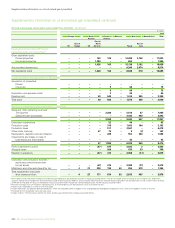
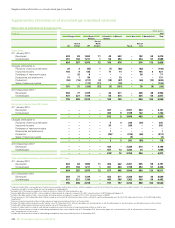
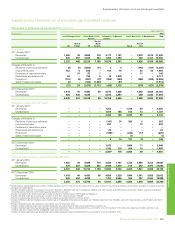
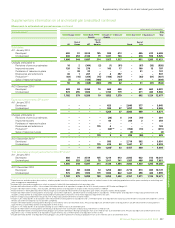
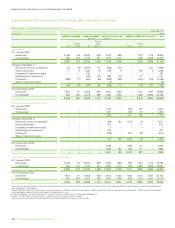
billioncubicfeet
Natural gasa 2010
Europe North South Africa Asia Australasia Total
America America
Rest of
Rest of North Rest of
UK Europe US America Russia Asia
Subsidiaries
At1January2010
Developed 1,602 49 9,583 716 3,177 1,107 – 1,579 3,219 21,032
Undeveloped 670 397 5,633 453 7,393 1,454 – 249 3,107 19,356
2,272 446 15,216 1,169 10,570 2,561 – 1,828 6,326 40,388
Changesattributableto
Revisionsofpreviousestimates (8) (5) (1,854) (11) 2 3 – (142) (191) (2,206)
Improvedrecovery 152 6 830 – 512 18 – 83 58 1,659
Purchasesofreserves-in-place – 31 97 1 – – – 17 – 146
Discoveriesandextensions 26 – 739 9 19 1,378 – – – 2,171
Productionbi(191) (8) (861) (77) (953) (229) – (228) (288) (2,835)
Salesofreserves-in-place (6) – (424) (1,033) – (51) – – – (1,514)
(27) 24 (1,473) (1,111) (420) 1,119 – (270) (421) (2,579)
At31December2010cf
Developed 1,416 40 9,495 58 3,575 1,329 – 1,290 3,563 20,766
Undeveloped 829 430 4,248 – 6,575 2,351 – 268 2,342 17,043
2,245 470 13,743 58 10,150 3,680 – 1,558 5,905 37,809
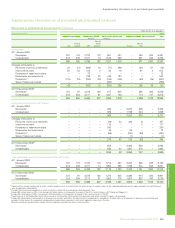
Equity-accountedentities(BPshare)e
At1January2010
Developed – – – –1,252 – 1,703 80 – 3,035
Undeveloped – – – –1,010 165 519 13 – 1,707
– – – – 2,262 165 2,222 93 – 4,742
Changesattributableto
Revisionsofpreviousestimates – – – – (141) 10 382 2 – 253
Improvedrecovery – – – – 291 – – 12 – 303
Purchasesofreserves-in-place – – – – – – – – – –
Discoveriesandextensions – – – – 23 – – – – 23
Productionb– – – – (168)h j – (244) (17) – (429)
Salesofreserves-in-place – – – – – – (1) – – (1)
– – – – 5 10 137 (3) – 149
At31December2010d
Developed – – – – 1,075 – 1,900 71 – 3,046
Undeveloped – – – – 1,192 175 459 19 – 1,845
– – – – 2,267g 175 2,359 90 – 4,891
Totalsubsidiariesandequity-accountedentities(BPshare)
At1January2010
Developed 1,602 49 9,583 716 4,429 1,107 1,703 1,659 3,219 24,067
Undeveloped 670 397 5,633 453 8,403 1,619 519 262 3,107 21,063
2,272 446 15,216 1,169 12,832 2,726 2,222 1,921 6,326 45,130
At31December2010
Developed 1,416 40 9,495 58 4,650 1,329 1,900 1,361 3,563 23,812
Undeveloped 829 430 4,248 – 7,767 2,526 459 287 2,342 18,888
2,245 470 13,743 58 12,417 3,855 2,359 1,648 5,905 42,700
a
Provedreservesexcluderoyaltiesduetoothers,whetherpayableincashorinkind,wheretheroyaltyownerhasadirectinterestintheunderlyingproductionandtheoptionandabilitytomakeliftingandsales
arrangementsindependently.
b
Includes
204billioncubicfeetofnaturalgasconsumedinoperations,166billioncubicfeetinsubsidiaries,38billioncubicfeetinequity-accountedentitiesandexcludes14billioncubicfeetofproduced
non-hydrocarboncomponentswhichmeetregulatoryrequirementsforsales.
c
Includes2,921billioncubicfeetofnaturalgasinrespectofthe30%minorityinterestinBPTrinidadandTobagoLLC.
d
Includes137billioncubicfeetofnaturalgasinrespectofthe5.89%minorityinterestinTNK-BP.
eVolumesofequity-accountedentitiesincludevolumesofequity-accountedinvestmentsofthoseentities.
fIncludes740billioncubicfeetrelatingtoassetsheldforsaleat31December2010.Amountsbyregionare:158billioncubicfeetinUS;205billioncubicfeetinSouthAmerica;and377billioncubicfeetin
RestofAsia.
gIncludes
1,819billioncubicfeetrelatingtoassetsheldforsaleat31December2010.
hIncludes12billioncubicfeetofgassalesrelatingtoproductionsinceclassicationofequity-accountedentitiesasheldforsale.
iIncludes133billioncubicfeetofgas(excludinggasconsumedinoperations)relatingtoproductionfromassetsheldforsaleat31December2010.Amountsbyregionare:23billioncubicfeetinUS;
27billioncubicfeetinSouthAmerica;and83billioncubicfeetinRestofAsia.
jIncludes
141billioncubicfeetofgas(excludinggasconsumedinoperations)relatingtoproductionfromassetsheldforsaleat31December2010.
BPAnnualReportandForm20-F2010 235