BP 2010 Annual Report Download - page 175
Download and view the complete annual report
Please find page 175 of the 2010 BP annual report below. You can navigate through the pages in the report by either clicking on the pages listed below, or by using the keyword search tool below to find specific information within the annual report.-
 1
1 -
2
-
3
-
4
-
5
-
6
-
7
-
8
-
9
-
10
-
11
-
12
-
13
-
14
-
15
-
16
-
17
-
18
-
19
-
20
-
21
-
22
-
23
-
24
-
25
-
26
-
27
-
28
-
29
-
30
-
31
-
32
-
33
-
34
-
35
-
36
-
37
-
38
-
39
-
40
-
41
-
42
-
43
-
44
-
45
-
46
-
47
-
48
-
49
-
50
-
51
-
52
-
53
-
54
-
55
-
56
-
57
-
58
-
59
-
60
-
61
-
62
-
63
-
64
-
65
-
66
-
67
-
68
-
69
-
70
-
71
-
72
-
73
-
74
-
75
-
76
-
77
-
78
-
79
-
80
-
81
-
82
-
83
-
84
-
85
-
86
-
87
-
88
-
89
-
90
-
91
-
92
-
93
-
94
-
95
-
96
-
97
-
98
-
99
-
100
-
101
-
102
-
103
-
104
-
105
-
106
-
107
-
108
-
109
-
110
-
111
-
112
-
113
-
114
-
115
-
116
-
117
-
118
-
119
-
120
-
121
-
122
-
123
-
124
-
125
-
126
-
127
-
128
-
129
-
130
-
131
-
132
-
133
-
134
-
135
-
136
-
137
-
138
-
139
-
140
-
141
-
142
-
143
-
144
-
145
-
146
-
147
-
148
-
149
-
150
-
151
-
152
-
153
-
154
-
155
-
156
-
157
-
158
-
159
-
160
-
161
-
162
-
163
-
164
-
 165
165 -
 166
166 -
 167
167 -
 168
168 -
 169
169 -
 170
170 -
 171
171 -
 172
172 -
 173
173 -
 174
174 -
 175
175 -
 176
176 -
 177
177 -
 178
178 -
 179
179 -
 180
180 -
 181
181 -
 182
182 -
 183
183 -
 184
184 -
 185
185 -
186
-
187
-
188
-
189
-
190
-
191
-
192
-
193
-
194
-
195
-
196
-
197
-
198
-
199
-
200
-
201
-
202
-
203
-
204
-
205
-
206
-
207
-
208
-
209
-
210
-
211
-
212
-
213
-
214
-
215
-
216
-
217
-
218
-
219
-
220
-
221
-
222
-
223
-
224
-
225
-
226
-
227
-
228
-
229
-
230
-
231
-
232
-
233
-
234
-
235
-
236
-
237
-
238
-
239
-
240
-
241
-
242
-
243
-
244
-
245
-
246
-
247
-
248
-
249
-
250
-
251
-
252
-
253
-
254
-
255
-
256
-
257
-
258
-
259
-
260
-
261
-
262
-
263
-
264
-
265
-
266
-
267
-
268
-
269
-
270
-
271
-
272
 |
 |

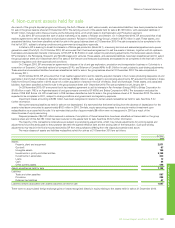
Notesonnancialstatements
Financial statements
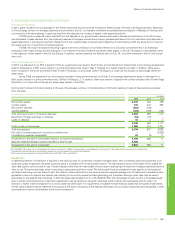
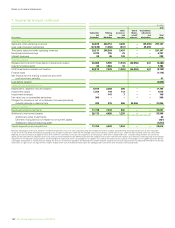
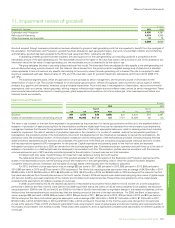
11.Impairmentreviewofgoodwill
$million
Goodwillat31December 2010 2009
ExplorationandProduction 4,450 4,297
ReningandMarketing 4,074 4,245
Otherbusinessesandcorporate 74 78
8,598 8,620
Goodwillacquiredthroughbusinesscombinationshasbeenallocatedtogroupsofcash-generatingunitsthatareexpectedtobenetfromthesynergiesof
theacquisition.ForExplorationandProduction,goodwillhasbeenallocatedtoeachgeographicregion,thatisUK,USandRestofWorld,andforRening
andMarketing,goodwillhasbeenallocatedtotheRhinefuelsvaluechain(FVC),LubricantsandOther.
Inassessingwhethergoodwillhasbeenimpaired,thecarryingamountofthecash-generatingunit(includinggoodwill)iscomparedwiththe
recoverableamountofthecash-generatingunit.Therecoverableamountisthehigheroffairvaluelesscoststosellandvalueinuse.Intheabsenceofany
informationaboutthefairvalueofacash-generatingunit,therecoverableamountisdeemedtobethevalueinuse.
Thegroupcalculatesthevalueinuseusingadiscountedcashowmodel.Thefuturecashowsareadjustedforrisksspecictothecash-generatingunit
andarediscountedusingapre-taxdiscountrate.Thediscountrateisderivedfromthegroup’spost-taxweightedaveragecostofcapitalandisadjusted
whereapplicabletotakeintoaccountanyspecicrisksrelatingtothecountrywherethecash-generatingunitislocated.Theratetobeappliedtoeach
countryisreassessedeachyear.Discountratesof12%and14%havebeenusedforgoodwillimpairmentcalculationsperformedin2010(200911%
and13%).
Thebusinesssegmentplans,whichareapprovedonanannualbasisbyseniormanagement,aretheprimarysourceofinformationforthe
determinationofvalueinuse.Theycontainforecastsforoilandnaturalgasproduction,renerythroughputs,salesvolumesforvarioustypesofrened
products(e.g.gasolineandlubricants),revenues,costsandcapitalexpenditure.Asaninitialstepinthepreparationoftheseplans,variousenvironmental
assumptions,suchasoilprices,naturalgasprices,reningmargins,renedproductmarginsandcostinationrates,aresetbyseniormanagement.These
environmentalassumptionstakeaccountofexistingprices,globalsupply-demandequilibriumforoilandnaturalgas,othermacroeconomicfactorsand
historicaltrendsandvariability.
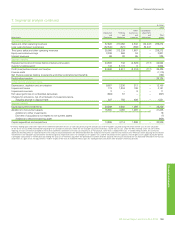
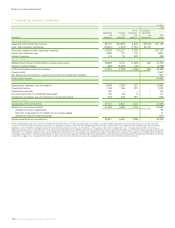
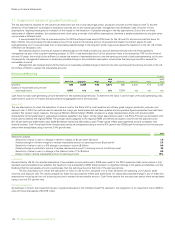
Exploration and Production
$million
2010 2009
Rest of Restof
UK US World Total UK US World Total
Goodwill 341 3,479 630 4,450 341 3,441 515 4,297
Excessofrecoverableamountovercarryingamount 7,556 18,968 41,714 n/a 7,721 15,528 n/a n/a
Thevalueinuseisbasedonthecashowsexpectedtobegeneratedbytheprojectedoilornaturalgasproductionprolesuptotheexpecteddatesof
cessationofproductionofeachproducingeld.Astheproductionproleandrelatedcashowscanbeestimatedfromthecompany’spastexperience,
managementbelievesthatthecashowsgeneratedovertheestimatedlifeofeldistheappropriatebasisuponwhichtoassessgoodwillandindividual
assetsforimpairment.Thedateofcessationofproductiondependsontheinteractionofanumberofvariables,suchastherecoverablequantitiesof
hydrocarbons,theproductionproleofthehydrocarbons,thecostofthedevelopmentoftheinfrastructurenecessarytorecoverthehydrocarbons,the
productioncosts,thecontractualdurationoftheproductionconcessionandthesellingpriceofthehydrocarbonsproduced.Aseachproducingeldhas
specicreservoircharacteristicsandeconomiccircumstances,thecashowsoftheeldsarecomputedusingappropriateindividualeconomicmodels
andkeyassumptionsagreedbyBP’smanagementforthepurpose.Capitalexpenditureandoperatingcostsfortherstfouryearsandexpected
hydrocarbonproductionprolesupto2020arederivedfromthebusinesssegmentplan.Estimatedproductionquantitiesandcashowsuptothedateof
cessationofproductiononaeld-by-eldbasisaredevelopedtobeconsistentwiththis.Theproductionprolesusedareconsistentwiththeresource
volumesapprovedaspartofBP’scentrally-controlledprocessfortheestimationofprovedreservesandtotalresources.
Consistentwithprioryears,the2010reviewforimpairmentwascarriedoutduringthefourthquarter.
ThetableaboveshowsthecarryingamountofthegoodwillallocatedtoeachoftheregionsoftheExplorationandProductionsegmentandthe
excessoftherecoverableamountoverthecarryingamount(theheadroom)inthecash-generatingunitstowhichthegoodwillhasbeenallocated.
Consistentwithpriorperiods,midstreamandintangibleoilandgasassetswereexcludedfromtheheadroomcalculation.
For2010,theBrentoilpriceassumptionwasanaverage$85perbarrelin2011,$88perbarrelin2012,$89perbarrelin2013,$89perbarrelin
2014,$90perbarrelin2015and$75perbarrelin2016andbeyond.TheHenryHubnaturalgaspriceassumptionwasanaverageof$4.25/mmBtuin2011,
$4.96/mmBtuin2012,$5.29/mmBtuin2013,$5.49/mmBtuin2014,$5.67/mmBtuin2015and$6.50/mmBtuin2016andbeyond.Thepricesfortherst
veyearswerederivedfromforwardpricecurvesinthefourthquarter.Pricesin2016andbeyondweredeterminedusinglong-termviewsofglobalsupply
anddemand,buildinguponpastexperienceoftheindustryandconsistentwithexternalsources.Thesepriceswereadjustedtoarriveatappropriate
consistentpriceassumptionsfordifferentqualitiesofoilandgas.
In2009,aspermittedbyIAS36,thedetailedcalculationsofrecoverableamountperformedin2008fortheUSandtheUK,andthecalculations
performedin2005fortheRestofWorld,wereusedforthe2009impairmenttestasthecriteriaofIAS36wereconsideredtobesatised:theheadroom
wassubstantialin2008(fortheUSandtheUK)and2005(fortheRestofWorld);therehadbeennosignicantchangeintheassetsandliabilities;andthe
likelihoodthattherecoverableamountwouldbelessthanthecarryingamountatthetimeofthetestwasremote.For2008,theBrentoilassumption
wasanaverage$49perbarrelin2009,$59perbarrelin2010,$65perbarrelin2011,$68perbarrelin2012,$70perbarrelin2013and$75perbarrelin
2014andbeyond.TheHenryHubnaturalgaspriceassumptionwasanaverageof$6.16/mmBtuin2009,$7.15/mmBtuin2010,$7.34/mmBtuin2011,
$7.62/mmBtuin2012,$7.60/mmBtuin2013and$7.50/mmBtuin2014andbeyond.Thepricesfortherstveyearswerederivedfromforwardprice
curvesattheyear-end.Pricesin2014andbeyondweredeterminedusinglong-termviewsofglobalsupplyanddemand,buildinguponpastexperienceof
theindustryandconsistentwithexternalsources.Thesepriceswereadjustedtoarriveatappropriateconsistentpriceassumptionsfordifferentqualitiesof
oilandgas.
BPAnnualReportandForm20-F2010 173