BP 2010 Annual Report Download - page 44
Download and view the complete annual report
Please find page 44 of the 2010 BP annual report below. You can navigate through the pages in the report by either clicking on the pages listed below, or by using the keyword search tool below to find specific information within the annual report.-
 1
1 -
2
-
3
-
4
-
5
-
6
-
7
-
8
-
9
-
10
-
11
-
12
-
13
-
14
-
15
-
16
-
17
-
18
-
19
-
20
-
21
-
22
-
23
-
24
-
25
-
26
-
27
-
28
-
29
-
30
-
31
-
32
-
33
-
 34
34 -
 35
35 -
 36
36 -
 37
37 -
 38
38 -
 39
39 -
 40
40 -
 41
41 -
 42
42 -
 43
43 -
 44
44 -
 45
45 -
 46
46 -
 47
47 -
 48
48 -
 49
49 -
 50
50 -
 51
51 -
 52
52 -
 53
53 -
 54
54 -
55
-
56
-
57
-
58
-
59
-
60
-
61
-
62
-
63
-
64
-
65
-
66
-
67
-
68
-
69
-
70
-
71
-
72
-
73
-
74
-
75
-
76
-
77
-
78
-
79
-
80
-
81
-
82
-
83
-
84
-
85
-
86
-
87
-
88
-
89
-
90
-
91
-
92
-
93
-
94
-
95
-
96
-
97
-
98
-
99
-
100
-
101
-
102
-
103
-
104
-
105
-
106
-
107
-
108
-
109
-
110
-
111
-
112
-
113
-
114
-
115
-
116
-
117
-
118
-
119
-
120
-
121
-
122
-
123
-
124
-
125
-
126
-
127
-
128
-
129
-
130
-
131
-
132
-
133
-
134
-
135
-
136
-
137
-
138
-
139
-
140
-
141
-
142
-
143
-
144
-
145
-
146
-
147
-
148
-
149
-
150
-
151
-
152
-
153
-
154
-
155
-
156
-
157
-
158
-
159
-
160
-
161
-
162
-
163
-
164
-
165
-
166
-
167
-
168
-
169
-
170
-
171
-
172
-
173
-
174
-
175
-
176
-
177
-
178
-
179
-
180
-
181
-
182
-
183
-
184
-
185
-
186
-
187
-
188
-
189
-
190
-
191
-
192
-
193
-
194
-
195
-
196
-
197
-
198
-
199
-
200
-
201
-
202
-
203
-
204
-
205
-
206
-
207
-
208
-
209
-
210
-
211
-
212
-
213
-
214
-
215
-
216
-
217
-
218
-
219
-
220
-
221
-
222
-
223
-
224
-
225
-
226
-
227
-
228
-
229
-
230
-
231
-
232
-
233
-
234
-
235
-
236
-
237
-
238
-
239
-
240
-
241
-
242
-
243
-
244
-
245
-
246
-
247
-
248
-
249
-
250
-
251
-
252
-
253
-
254
-
255
-
256
-
257
-
258
-
259
-
260
-
261
-
262
-
263
-
264
-
265
-
266
-
267
-
268
-
269
-
270
-
271
-
272
 |
 |
Businessreview
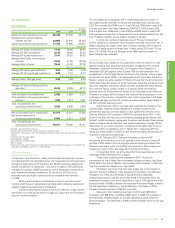
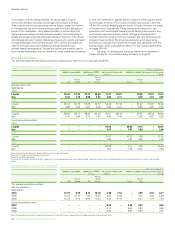
Thereplacementcostprotbeforeinterestandtaxfor2010was
$30,886million,comparedwith$24,800millionforthepreviousyear.
2010includednetnon-operatinggainsof$3,199million,primarilygainson
disposalsthatcompletedduringtheyearpartlyoffsetbyimpairment
chargesandfairvaluelossesonembeddedderivatives.(See page 25 for
further information on non-operating items.)Inaddition,fairvalue
accountingeffectshadanunfavourableimpactof$3millionrelativeto
management’smeasureofperformance.(See page 26 for further
information on fair value accounting effects.)
Theprimaryadditionalfactorscontributingtothe25%increasein
replacementcostprotbeforeinterestandtaxwerehigherrealizations,
lowerdepreciationandhigherearningsfromequity-accountedentities,
mainlyTNK-BP,partlyoffsetbylowerproduction,asignicantlylower
contributionfromgasmarketingandtradingandhigherproductiontaxes.
Totalcapitalexpenditureincludingacquisitionsandassetexchanges
in2010was$17.8billion(2009$14.9billionand2008$22.2billion).For
furtherinformationonacquisitionsanddisposalsseepages43-44.
Developmentexpenditureofsubsidiariesincurredin2010,
excludingmidstreamactivities,was$9.7billion,comparedwith
$10.4billionin2009and$11.8billionin2008.
Prioryears’comparativenancialinformation
Thereplacementcostprotbeforeinterestandtaxfortheyearended
31December2009of$24,800millionincludedanetcreditfornon-
operatingitemsof$2,265million,withthemostsignicantitemsbeing
gainsonthesaleofoperations(primarilyfromthedisposalofour46%
stakeinLukArco,thesaleofour49.9%interestinKazakhstanPipeline
VenturesLLCandthesaleofBPWestJavaLimitedinIndonesia)andfair
valuegainsonembeddedderivatives.Inaddition,fairvalueaccounting
effectshadafavourableimpactof$919millionrelativetomanagement’s
measureofperformance.
Thereplacementcostprotbeforeinterestandtaxfortheyear
ended31December2008was$38,308millionandincludedanetcharge
fornon-operatingitemsof$990million,withthemostsignicantitems
beingnetimpairmentchargesandnetfairvaluelossesonembedded
derivatives,partlyoffsetbythereversalofcertainprovisions.The
impairmentchargeincludeda$517millionwrite-downofourinvestmentin
Rosneftbasedonitsquotedmarketpriceattheendoftheyear.Inaddition,
fairvalueaccountingeffectshadanunfavourableimpactof$282million
relativetomanagement’smeasureofperformance.
Theprimaryadditionalfactorcontributingtothe35%decreasein
thereplacementcostprotbeforeinterestandtaxfortheyearended
31December2009comparedwiththeyearended31December2008was
lowerrealizations.Inaddition,theresultwasimpactedbylowerincome
fromequity-accountedentitiesandhigherdepreciationbuttheresult
benetedfromhigherproductionandlowercosts,asaresultofour
continuedfocusoncostmanagement.
Outlook
In2011,wewillseektocontinuouslydriveoperationalriskreduction
throughtheS&ORfunction.Throughtherestructuringintodivisions,we
intendtodrivefunctionalexcellenceacrossthelifecycleofexploration,
developmentsandproductionandcontinuetofocusonbuildingour
technologicalandhumancapabilityforthefuture.
Webelievethatourportfolioofassetsremainswellpositionedto
competeandgrowvalueinarangeofexternalconditions.Wewillcontinue
toactivelymanageourportfoliowithafocusonvaluegrowth.
Upstream activities
Exploration
Thegroupexploresforoilandnaturalgasunderawiderangeoflicensing,
jointventureandothercontractualagreements.Wemaydothisaloneor,
morefrequently,withpartners.BPactsasoperatorformanyofthese
ventures.
Ourexplorationandappraisalcosts,excludingleaseacquisitions,in
2010were$2,706million,comparedwith$2,805millionin2009and
$2,290millionin2008.Thesecostsincludedexplorationandappraisal
drillingexpenditures,whichwerecapitalizedwithinintangiblexedassets,
andgeologicalandgeophysicalexplorationcosts,whichwerechargedto
incomeasincurred.Approximately80%of2010explorationandappraisal
costsweredirectedtowardsappraisalactivity.In2010,weparticipatedin
479gross(95.5net)explorationandappraisalwellsin10countries.The
principalareasofexplorationandappraisalactivitywereEgypt,the
deepwaterGulfofMexico,Libya,theNorthSea,OmanandonshoreUS.
Totalexplorationexpensein2010of$843million(2009$1,116
millionand2008$882million)includedthewrite-offofexpensesrelated
tounsuccessfuldrillingactivitiesinthedeepwaterGulfofMexico
($161million),theNorthSea($42million),Libya($26million),Angola
($24million)andothers($4million).Italsoincluded$157millionrelatedto
decommissioningofidleinfrastructure,asrequiredbytheBureauofOcean
EnergyManagementRegulationandEnforcement’sNoticeofLessees
2010G05issuedinOctober2010.
Reservesbookingfromnewdiscoverieswilldependontheresults
ofongoingtechnicalandcommercialevaluations,includingappraisaldrilling.
Provedreservesreplacement
Totalhydrocarbonprovedreserves,onanoilequivalentbasisincluding
equity-accountedentities,comprised18,071mmboe(12,077mmboefor
subsidiariesand5,994mmboeforequity-accountedentities)at
31December2010,adecreaseof1%(decreaseof4%forsubsidiariesand
increaseof6%forequity-accountedentities)comparedwiththe
31December2009reservesof18,292mmboe(12,621mmboefor
subsidiariesand5,671mmboeforequity-accountedentities).Naturalgas
representedabout41%(54%forsubsidiariesand14%forequity-
accountedentities)ofthesereserves.Thechangeincludesanetdecrease
fromacquisitionsanddisposalsof307mmboe(303mmboenetdecrease
forsubsidiariesand4mmboenetdecreaseforequity-accountedentities).
AcquisitionsoccurredinAzerbaijan,Canada,NorwayandtheUS.Disposals
occurredinCanada,EgyptandtheUS.
Theprovedreservesreplacementratioistheextenttowhich
productionisreplacedbyprovedreservesadditions.Thisratioisexpressed
inoilequivalenttermsandincludeschangesresultingfromrevisionsto
previousestimates,improvedrecoveryandextensionsanddiscoveries.For
2010theprovedreservesreplacementratioexcludingacquisitionsand
disposalswas106%(129%in2009and121%in2008)forsubsidiariesand
equity-accountedentities,74%forsubsidiariesaloneand166%for
equity-accountedentitiesalone.
In2010,netadditionstothegroup’sprovedreserves(excluding
productionandsalesandpurchasesofreserves-in-place)amountedto
1,503mmboe(686mmboeforsubsidiariesand818mmboeforequity-
accountedentities),principallythroughimprovedrecoveryfrom,and
extensionsto,existingeldsanddiscoveriesofnewelds.Ofour
subsidiaryreservesadditionsthroughimprovedrecoveryfrom,and
extensionsto,existingeldsanddiscoveriesofnewelds,approximately
67%wereassociatedwithnewprojectsandwereprovedundeveloped
reservesadditions.Theremainingadditionsareinexistingdevelopments
wheretheyrepresentamixtureofproveddevelopedandproved
undevelopedreserves.Volumesaddedin2010principallyreliedonthe
applicationofconventionaltechnologies.Theprincipalreservesadditionsin
oursubsidiarieswereintheUS(Arkoma,Hawkville,Kuparuk,Mars,
PrudhoeBay,ThunderHorse,TubularBells),theUK(Kinnoull,Loyal,Machar,
Schiehallion),Egypt(WestNileDelta),Trinidad(Immortelle)andIraq
(Rumaila).Theprincipalreservesadditionsinourequity-accountedentities
wereinArgentina(CerroDragon),Bolivia(Margarita),Canada(Sunrise)and
inRussia(Samotlor,Sorochinsko-Nikolskoye,Talinskoye,Uvat).
42BPAnnualReportandForm20-F2010