BP 2010 Annual Report Download - page 232
Download and view the complete annual report
Please find page 232 of the 2010 BP annual report below. You can navigate through the pages in the report by either clicking on the pages listed below, or by using the keyword search tool below to find specific information within the annual report.-
 1
1 -
2
-
3
-
4
-
5
-
6
-
7
-
8
-
9
-
10
-
11
-
12
-
13
-
14
-
15
-
16
-
17
-
18
-
19
-
20
-
21
-
22
-
23
-
24
-
25
-
26
-
27
-
28
-
29
-
30
-
31
-
32
-
33
-
34
-
35
-
36
-
37
-
38
-
39
-
40
-
41
-
42
-
43
-
44
-
45
-
46
-
47
-
48
-
49
-
50
-
51
-
52
-
53
-
54
-
55
-
56
-
57
-
58
-
59
-
60
-
61
-
62
-
63
-
64
-
65
-
66
-
67
-
68
-
69
-
70
-
71
-
72
-
73
-
74
-
75
-
76
-
77
-
78
-
79
-
80
-
81
-
82
-
83
-
84
-
85
-
86
-
87
-
88
-
89
-
90
-
91
-
92
-
93
-
94
-
95
-
96
-
97
-
98
-
99
-
100
-
101
-
102
-
103
-
104
-
105
-
106
-
107
-
108
-
109
-
110
-
111
-
112
-
113
-
114
-
115
-
116
-
117
-
118
-
119
-
120
-
121
-
122
-
123
-
124
-
125
-
126
-
127
-
128
-
129
-
130
-
131
-
132
-
133
-
134
-
135
-
136
-
137
-
138
-
139
-
140
-
141
-
142
-
143
-
144
-
145
-
146
-
147
-
148
-
149
-
150
-
151
-
152
-
153
-
154
-
155
-
156
-
157
-
158
-
159
-
160
-
161
-
162
-
163
-
164
-
165
-
166
-
167
-
168
-
169
-
170
-
171
-
172
-
173
-
174
-
175
-
176
-
177
-
178
-
179
-
180
-
181
-
182
-
183
-
184
-
185
-
186
-
187
-
188
-
189
-
190
-
191
-
192
-
193
-
194
-
195
-
196
-
197
-
198
-
199
-
200
-
201
-
202
-
203
-
204
-
205
-
206
-
207
-
208
-
209
-
210
-
211
-
212
-
213
-
214
-
215
-
216
-
217
-
218
-
219
-
220
-
221
-
 222
222 -
 223
223 -
 224
224 -
 225
225 -
 226
226 -
 227
227 -
 228
228 -
 229
229 -
 230
230 -
 231
231 -
 232
232 -
 233
233 -
 234
234 -
 235
235 -
 236
236 -
 237
237 -
 238
238 -
 239
239 -
 240
240 -
 241
241 -
 242
242 -
243
-
244
-
245
-
246
-
247
-
248
-
249
-
250
-
251
-
252
-
253
-
254
-
255
-
256
-
257
-
258
-
259
-
260
-
261
-
262
-
263
-
264
-
265
-
266
-
267
-
268
-
269
-
270
-
271
-
272
 |
 |

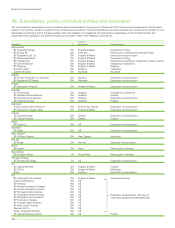
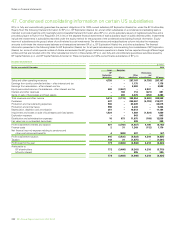
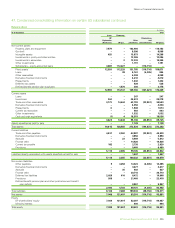
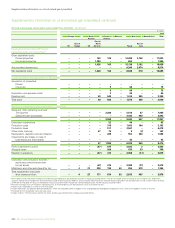
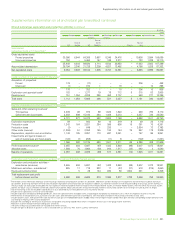
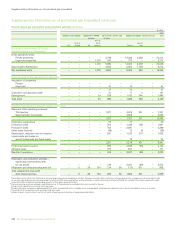
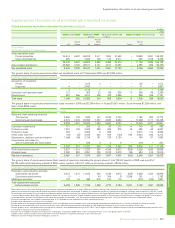
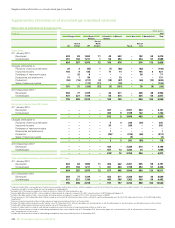
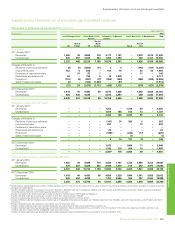
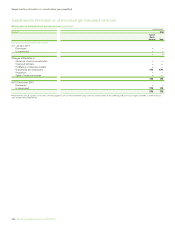
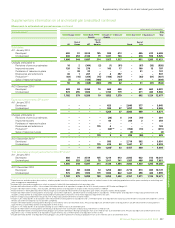
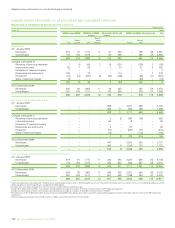
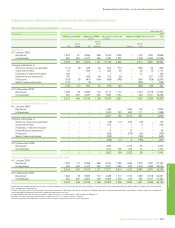
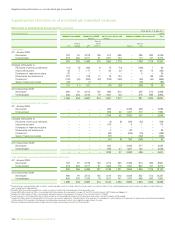
Supplementaryinformationonoilandnaturalgas(unaudited)
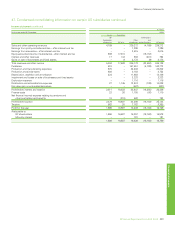
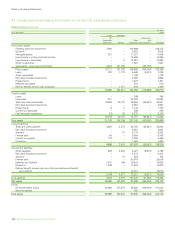
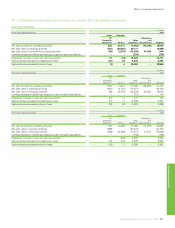
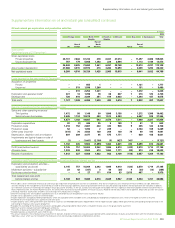
Supplementaryinformationonoilandnaturalgas(unaudited)continued
Oil and natural gas exploration and production activities continued
$million
2010
Europe North South Africa Asia Australasia Total
America America
Rest of
Rest of North Rest of
UK Europe US America Russia Asia
Equity-accountedentities(BPshare)a
Capitalizedcostsat31Decemberb
Grosscapitalizedcosts
Provedproperties – – – 142 103 – 14,486 3,192 – 17,923
Unprovedproperties – – – 1,284 – – 652 – – 1,936
– – – 1,426 103 – 15,138 3,192 – 19,859
Accumulateddepreciation – – – – – – 6,300 2,674 – 8,974
Netcapitalizedcosts – – – 1,426 103 – 8,838 518 – 10,885
Costsincurredfortheyearended31Decemberb
Acquisitionofpropertiesc
Proved – – – – – – – – – –
Unproved – – – – 9 – 66 – – 75
– – – – 9 – 66 – – 75
Explorationandappraisalcostsd– – – – 2 – 94 – – 96
Development – – – 49 549 – 1,416 355 – 2,369
Totalcosts – – – 49 560 – 1,576 355 – 2,540
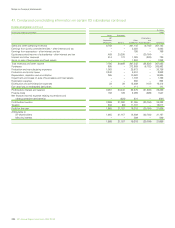
Resultsofoperationsfortheyearended31December
Salesandotheroperatingrevenuese
Thirdparties – – – – 2,268 – 5,610 87 – 7,965
Salesbetweenbusinesses – – – – – – 3,432 460 – 3,892
– – – – 2,268 – 9,042 547 – 11,857
Explorationexpenditure – – – – 22 – 40 – – 62
Productioncosts – – – – 316 – 1,602 184 – 2,102
Productiontaxes – – – – 911 – 3,567 – – 4,478
Othercosts(income) – – – 67 75 – 3 (2) – 143
Depreciation,depletionandamortization – – – – 269 – 954 363 – 1,586
Impairmentsandlossesonsaleof
businessesandxedassets – – – – – – 43 – – 43
– – – 67 1,593 – 6,209 545 – 8,414
Prot(loss)beforetaxation – – – (67) 675 – 2,833 2 – 3,443
Allocabletaxes – – – – 260 – 475 33 – 768
Resultsofoperations – – – (67) 415 – 2,358 (31) – 2,675
Explorationandproductionactivities–
equity-accountedentitiesafter
tax(asabove) – – – (67) 415 – 2,358 (31) – 2,675
Midstreamandotheractivitiesaftertaxf– 4 27 238 199 63 255 518 – 1,304
Totalreplacementcostprot
afterinterestandtax – 4 27 171 614 63 2,613 487 – 3,979
aThesetablescontaininformationrelatingtooilandnaturalgasexplorationandproductionactivitiesofequity-accountedentities.Theydonotincludeamountsrelatingtoassetsheldforsale.Midstream
activitiesrelatingtothemanagementandownershipofcrudeoilandnaturalgaspipelines,processingandexportterminalsandLNGprocessingfacilitiesandtransportationaswellasdownstreamactivities
ofTNK-BPareexcluded.Theamountsreportedforequity-accountedentitiesexcludethecorrespondingamountsfortheirequity-accountedentities.
bDecommissioning
assetsareincludedincapitalizedcostsat31Decemberbutareexcludedfromcostsincurredfortheyear.
cIncludescostscapitalizedasaresultofassetexchanges.
dIncludesexplorationandappraisaldrillingexpenditures,whicharecapitalizedwithinintangibleassets,andgeologicalandgeophysicalexplorationcosts,whicharechargedtoincomeasincurred.
ePresentednetoftransportationcostsandsalestaxes.
fIncludesinterest,minorityinterestandthenetresultsofequity-accountedentitiesofequity-accountedentities.
230BPAnnualReportandForm20-F2010