BP 2010 Annual Report Download - page 262
Download and view the complete annual report
Please find page 262 of the 2010 BP annual report below. You can navigate through the pages in the report by either clicking on the pages listed below, or by using the keyword search tool below to find specific information within the annual report.-
 1
1 -
2
-
3
-
4
-
5
-
6
-
7
-
8
-
9
-
10
-
11
-
12
-
13
-
14
-
15
-
16
-
17
-
18
-
19
-
20
-
21
-
22
-
23
-
24
-
25
-
26
-
27
-
28
-
29
-
30
-
31
-
32
-
33
-
34
-
35
-
36
-
37
-
38
-
39
-
40
-
41
-
42
-
43
-
44
-
45
-
46
-
47
-
48
-
49
-
50
-
51
-
52
-
53
-
54
-
55
-
56
-
57
-
58
-
59
-
60
-
61
-
62
-
63
-
64
-
65
-
66
-
67
-
68
-
69
-
70
-
71
-
72
-
73
-
74
-
75
-
76
-
77
-
78
-
79
-
80
-
81
-
82
-
83
-
84
-
85
-
86
-
87
-
88
-
89
-
90
-
91
-
92
-
93
-
94
-
95
-
96
-
97
-
98
-
99
-
100
-
101
-
102
-
103
-
104
-
105
-
106
-
107
-
108
-
109
-
110
-
111
-
112
-
113
-
114
-
115
-
116
-
117
-
118
-
119
-
120
-
121
-
122
-
123
-
124
-
125
-
126
-
127
-
128
-
129
-
130
-
131
-
132
-
133
-
134
-
135
-
136
-
137
-
138
-
139
-
140
-
141
-
142
-
143
-
144
-
145
-
146
-
147
-
148
-
149
-
150
-
151
-
152
-
153
-
154
-
155
-
156
-
157
-
158
-
159
-
160
-
161
-
162
-
163
-
164
-
165
-
166
-
167
-
168
-
169
-
170
-
171
-
172
-
173
-
174
-
175
-
176
-
177
-
178
-
179
-
180
-
181
-
182
-
183
-
184
-
185
-
186
-
187
-
188
-
189
-
190
-
191
-
192
-
193
-
194
-
195
-
196
-
197
-
198
-
199
-
200
-
201
-
202
-
203
-
204
-
205
-
206
-
207
-
208
-
209
-
210
-
211
-
212
-
213
-
214
-
215
-
216
-
217
-
218
-
219
-
220
-
221
-
222
-
223
-
224
-
225
-
226
-
227
-
228
-
229
-
230
-
231
-
232
-
233
-
234
-
235
-
236
-
237
-
238
-
239
-
240
-
241
-
242
-
243
-
244
-
245
-
246
-
247
-
248
-
249
-
250
-
251
-
 252
252 -
 253
253 -
 254
254 -
 255
255 -
 256
256 -
 257
257 -
 258
258 -
 259
259 -
 260
260 -
 261
261 -
 262
262 -
 263
263 -
 264
264 -
 265
265 -
 266
266 -
 267
267 -
 268
268 -
 269
269 -
 270
270 -
 271
271 -
 272
272
 |
 |

ParentcompanynancialstatementsofBPp.l.c.
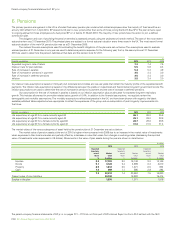
6.Pensionscontinued
$million
2010 2009
Representedby
Assetrecognized 2,069 1,234
Liabilityrecognized (199) (163)
1,870 1,071
Thesurplus(decit)maybeanalysedbetweenfundedandunfundedplansasfollows
Funded 2,064 1,231
Unfunded (194) (160)
1,870 1,071
Thedenedbenetobligationmaybeanalysedbetweenfundedandunfundedplansasfollows
Fundeda (20,548) (19,722)
Unfunded (194) (160)
(20,742) (19,882)
aR eects$20,448millionofliabilitiesoftheBPPensionFund(2009$19,661million),$67millionofliabilitiesoftheBPGlobalPensionTrust(2009$61million)and$33millionofliabilitiesrepresentingthe
company’sshareoftheMerchantNavyOfcersPensionFund(2009nil).
$million
2010 2009
Reconciliationofplansurplustobalancesheet
Surplusat31December 1,870 1,071
Deferredtax (480) (279)
1,390 792
Representedby
Assetrecognizedonbalancesheet 1,537 912
Liabilityrecognizedonbalancesheet (147) (120)
1,390 792
TheaggregatelevelofemployercontributionsintotheBPPensionFundin2011isexpectedtobe$404million.
$million
2010 2009 2008 2007 2006
Historyofsurplusandofexperiencegainsandlosses
Benetobligationat31December 20,742 19,882 15,414 22,146 21,507
Fairvalueofplanassetsat31December 22,612 20,953 16,930 29,411 27,169
Surplus 1,870 1,071 1,516 7,265 5,662
Experiencegains(losses)onplanliabilities
Amount($million) 12 (146) (65) (155) (211)
Percentageofbenetobligation 0% (1)% 0% (1)% (1)%
Actualreturnlessexpectedreturnonpensionplanassets
Amount($million) 1,479 1,634 (6,533) 404 1,252
Percentageofplanassets 7% 8% (39)% 1% 5%
Actuarial(loss)gainrecognizedinstatementoftotalrecognizedgainsandlosses
Amount($million) 457 (585) (5,122) 698 1,120
Percentageofbenetobligation 2% (3)% (33)% 3% 6%
Cumulativeamountrecognizedinstatementoftotalrecognizedgainsandlosses (1,235) (1,692) (1,107) 4,015 3,317
TheparentcompanynancialstatementsofBPp.l.c.onpagesPC1–PC16donotformpartofBP’sAnnualReportonForm20-FasledwiththeSEC.
PC10BPAnnualReportandForm20-F2010