BP 2010 Annual Report Download - page 217
Download and view the complete annual report
Please find page 217 of the 2010 BP annual report below. You can navigate through the pages in the report by either clicking on the pages listed below, or by using the keyword search tool below to find specific information within the annual report.-
 1
1 -
2
-
3
-
4
-
5
-
6
-
7
-
8
-
9
-
10
-
11
-
12
-
13
-
14
-
15
-
16
-
17
-
18
-
19
-
20
-
21
-
22
-
23
-
24
-
25
-
26
-
27
-
28
-
29
-
30
-
31
-
32
-
33
-
34
-
35
-
36
-
37
-
38
-
39
-
40
-
41
-
42
-
43
-
44
-
45
-
46
-
47
-
48
-
49
-
50
-
51
-
52
-
53
-
54
-
55
-
56
-
57
-
58
-
59
-
60
-
61
-
62
-
63
-
64
-
65
-
66
-
67
-
68
-
69
-
70
-
71
-
72
-
73
-
74
-
75
-
76
-
77
-
78
-
79
-
80
-
81
-
82
-
83
-
84
-
85
-
86
-
87
-
88
-
89
-
90
-
91
-
92
-
93
-
94
-
95
-
96
-
97
-
98
-
99
-
100
-
101
-
102
-
103
-
104
-
105
-
106
-
107
-
108
-
109
-
110
-
111
-
112
-
113
-
114
-
115
-
116
-
117
-
118
-
119
-
120
-
121
-
122
-
123
-
124
-
125
-
126
-
127
-
128
-
129
-
130
-
131
-
132
-
133
-
134
-
135
-
136
-
137
-
138
-
139
-
140
-
141
-
142
-
143
-
144
-
145
-
146
-
147
-
148
-
149
-
150
-
151
-
152
-
153
-
154
-
155
-
156
-
157
-
158
-
159
-
160
-
161
-
162
-
163
-
164
-
165
-
166
-
167
-
168
-
169
-
170
-
171
-
172
-
173
-
174
-
175
-
176
-
177
-
178
-
179
-
180
-
181
-
182
-
183
-
184
-
185
-
186
-
187
-
188
-
189
-
190
-
191
-
192
-
193
-
194
-
195
-
196
-
197
-
198
-
199
-
200
-
201
-
202
-
203
-
204
-
205
-
206
-
 207
207 -
 208
208 -
 209
209 -
 210
210 -
 211
211 -
 212
212 -
 213
213 -
 214
214 -
 215
215 -
 216
216 -
 217
217 -
 218
218 -
 219
219 -
 220
220 -
 221
221 -
 222
222 -
 223
223 -
 224
224 -
 225
225 -
 226
226 -
 227
227 -
228
-
229
-
230
-
231
-
232
-
233
-
234
-
235
-
236
-
237
-
238
-
239
-
240
-
241
-
242
-
243
-
244
-
245
-
246
-
247
-
248
-
249
-
250
-
251
-
252
-
253
-
254
-
255
-
256
-
257
-
258
-
259
-
260
-
261
-
262
-
263
-
264
-
265
-
266
-
267
-
268
-
269
-
270
-
271
-
272
 |
 |

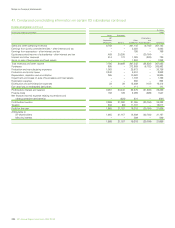
Notesonnancialstatements
Financial statements
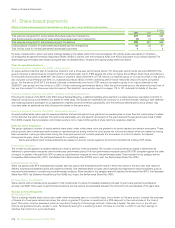
41.Share-basedpaymentscontinued
BPShareMatchPlans
ThesearematchingshareplansunderwhichBPmatchesemployees’owncontributionsofsharesuptoapredeterminedlimit.TheplansarerunintheUK
andinmorethan60othercountries.TheUKplanisrunonamonthlybasiswithsharesbeingheldintrustforveyearsbeforetheycanbereleasedfreeof
anyincometaxandnationalinsuranceliability.Inothercountriestheplanisrunonanannualbasiswithsharesbeingheldintrustforthreeyears.Theplan
isoperatedonacashbasisinthosecountrieswherethereareregulatoryrestrictionspreventingtheholdingofBPshares.WhentheemployeeleavesBP
allsharesmustberemovedfromtrustandunitsundertheplanoperatedonacashbasismustbeencashed.
Localplans
InsomecountriesBPprovideslocalschemebenets,therulesandqualicationsforwhichvaryaccordingtolocalcircumstances.
Employee Share Ownership Plans (ESOPs)
ESOPshavebeenestablishedtoacquireBPsharestosatisfyanyawardsmadetoparticipantsundertheBPshareplansasrequired.TheESOPs
havewaivedtheirrightstodividendsonsharesheldforfutureawardsandarefundedbythegroup.Untilsuchtimeasthecompany’sownshares
heldbytheESOPtrustsvestunconditionallytoemployees,theamountpaidforthosesharesisdeductedinarrivingatshareholders’equity
(seeNote40).AssetsandliabilitiesoftheESOPsarerecognizedasassetsandliabilitiesofthegroup.
At31December2010theESOPsheld11,477,253shares(200918,062,246sharesand200829,051,082shares)forpotentialfutureawards,which
hadamarketvalueof$82million(2009$174millionand2008$220million).
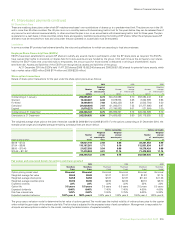
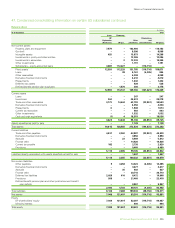
Share option transactions
Detailsofshareoptiontransactionsfortheyearundertheshareoptionplansareasfollows:
2010 2009 2008
Weighted Weighted Weighted
Number average Number average Number average
of exercise price of exerciseprice of exerciseprice
options $ options $ options $
Outstandingat1January 295,895,357 8.73 326,254,599 8.70 358,094,243 8.51
Granted 10,420,287 6.08 9,679,836 6.55 8,062,899 8.96
Forfeited (9,499,661) 7.88 (5,954,325) 8.81 (2,502,784) 8.50
Exercised (31,839,034) 7.97 (21,293,871) 7.53 (37,277,895) 6.97
Expired (1,670,227) 8.71 (12,790,882) 8.01 (121,864) 7.00
Outstandingat31December 263,306,722 8.75 295,895,357 8.73 326,254,599 8.70
Exercisableat31December 242,530,635 8.90 274,685,068 8.80 260,178,938 8.22
Theweightedaveragesharepriceatthedateofexercisewas$9.54(2009$9.10and2008$10.87).Fortheoptionsoutstandingat31December2010,the
exercisepricerangesandweightedaverageremainingcontractuallivesareshownbelow.
Options outstanding Options exercisable
Weighted Weighted Weighted
Number average average Number average
of remaining life exercise price of exercise price
Rangeofexerciseprices shares Years $ shares $
$6.09–$7.53 54,821,144 2.68 6.36 39,231,453 6.40
$7.54–$8.99 115,187,261 1.71 8.19 112,551,834 8.17
$9.00–$10.45 21,827,393 3.54 9.88 19,276,424 9.98
$10.46–$11.92 71,470,924 4.81 11.14 71,470,924 11.14
263,306,722 2.90 8.75 242,530,635 8.90
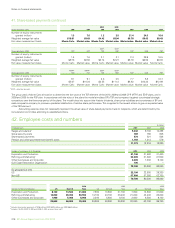
Fair values and associated details for options and shares granted
2010 2009 2008
ShareSave ShareSave ShareSave ShareSave ShareSave ShareSave
3 year 5 year 3year 5year 3year 5year
Optionpricingmodelused Binomial Binomial Binomial Binomial Binomial Binomial
Weightedaveragefairvalue $0.06 $0.08 $1.07 $1.07 $1.82 $1.74
Weightedaverageshareprice $4.58 $4.58 $7.87 $7.87 $11.26 $11.26
Weightedaverageexerciseprice $5.90 $5.90 $6.92 $6.92 $9.70 $9.70
Expectedvolatility 22% 23% 32% 32% 23% 23%
Optionlife 3.5 years 5.5 years 3.5years 5.5years 3.5years 5.5years
Expecteddividends 8.40% 8.40% 7.40% 7.40% 4.60% 4.60%
Riskfreeinterestrate 1.25% 2.00% 3.00% 3.75% 5.00% 5.00%
Expectedexercisebehaviour 100% year 4 100% year 6 100%year4 100%year6 100%year4 100%year6
Thegroupusesavaluationmodeltodeterminethefairvalueofoptionsgranted.Themodelusestheimpliedvolatilityofordinarysharepriceforthequarter
withinwhichthegrantdateoftherelevantplanfalls.Thefairvalueisadjustedfortheexpectedratesofearlycancellation.Managementisresponsiblefor
allinputsandassumptionsinrelationtothemodel,includingthedeterminationofexpectedvolatility.
BPAnnualReportandForm20-F2010 215