BP 2010 Annual Report Download - page 234
Download and view the complete annual report
Please find page 234 of the 2010 BP annual report below. You can navigate through the pages in the report by either clicking on the pages listed below, or by using the keyword search tool below to find specific information within the annual report.-
 1
1 -
2
-
3
-
4
-
5
-
6
-
7
-
8
-
9
-
10
-
11
-
12
-
13
-
14
-
15
-
16
-
17
-
18
-
19
-
20
-
21
-
22
-
23
-
24
-
25
-
26
-
27
-
28
-
29
-
30
-
31
-
32
-
33
-
34
-
35
-
36
-
37
-
38
-
39
-
40
-
41
-
42
-
43
-
44
-
45
-
46
-
47
-
48
-
49
-
50
-
51
-
52
-
53
-
54
-
55
-
56
-
57
-
58
-
59
-
60
-
61
-
62
-
63
-
64
-
65
-
66
-
67
-
68
-
69
-
70
-
71
-
72
-
73
-
74
-
75
-
76
-
77
-
78
-
79
-
80
-
81
-
82
-
83
-
84
-
85
-
86
-
87
-
88
-
89
-
90
-
91
-
92
-
93
-
94
-
95
-
96
-
97
-
98
-
99
-
100
-
101
-
102
-
103
-
104
-
105
-
106
-
107
-
108
-
109
-
110
-
111
-
112
-
113
-
114
-
115
-
116
-
117
-
118
-
119
-
120
-
121
-
122
-
123
-
124
-
125
-
126
-
127
-
128
-
129
-
130
-
131
-
132
-
133
-
134
-
135
-
136
-
137
-
138
-
139
-
140
-
141
-
142
-
143
-
144
-
145
-
146
-
147
-
148
-
149
-
150
-
151
-
152
-
153
-
154
-
155
-
156
-
157
-
158
-
159
-
160
-
161
-
162
-
163
-
164
-
165
-
166
-
167
-
168
-
169
-
170
-
171
-
172
-
173
-
174
-
175
-
176
-
177
-
178
-
179
-
180
-
181
-
182
-
183
-
184
-
185
-
186
-
187
-
188
-
189
-
190
-
191
-
192
-
193
-
194
-
195
-
196
-
197
-
198
-
199
-
200
-
201
-
202
-
203
-
204
-
205
-
206
-
207
-
208
-
209
-
210
-
211
-
212
-
213
-
214
-
215
-
216
-
217
-
218
-
219
-
220
-
221
-
222
-
223
-
 224
224 -
 225
225 -
 226
226 -
 227
227 -
 228
228 -
 229
229 -
 230
230 -
 231
231 -
 232
232 -
 233
233 -
 234
234 -
 235
235 -
 236
236 -
 237
237 -
 238
238 -
 239
239 -
 240
240 -
 241
241 -
 242
242 -
 243
243 -
 244
244 -
245
-
246
-
247
-
248
-
249
-
250
-
251
-
252
-
253
-
254
-
255
-
256
-
257
-
258
-
259
-
260
-
261
-
262
-
263
-
264
-
265
-
266
-
267
-
268
-
269
-
270
-
271
-
272
 |
 |

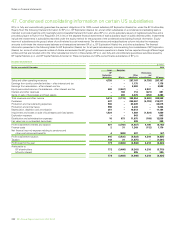
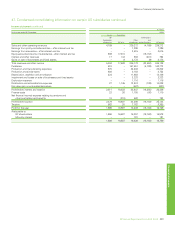
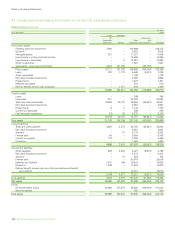
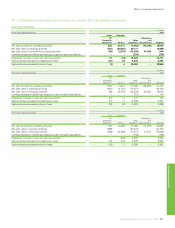
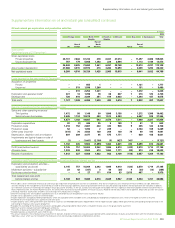
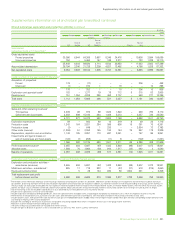
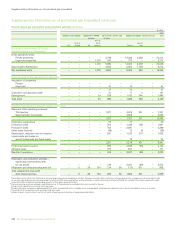
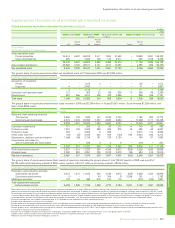
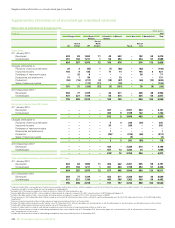
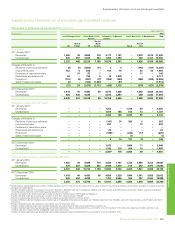
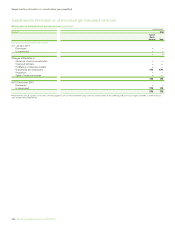
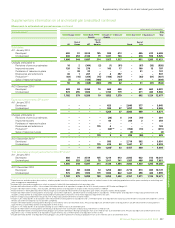
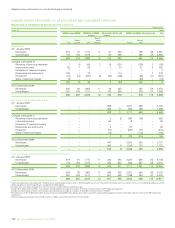
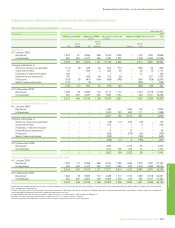
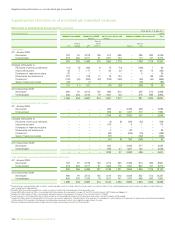
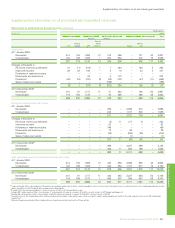
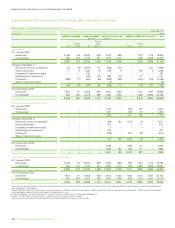
Supplementaryinformationonoilandnaturalgas(unaudited)
Supplementaryinformationonoilandnaturalgas(unaudited)continued
Oil and natural gas exploration and production activities continued
$million
2009
Europe North South Africa Asia Australasia Total
America America
Restof
Restof North Restof
UK Europe US America Russia Asia
Equity-accountedentities(BPshare)a
Capitalizedcostsat31Decemberb
Grosscapitalizedcosts
Provedproperties – – – – 5,789 – 13,266 2,259 – 21,314
Unprovedproperties – – – 1,378 197 – 737 – – 2,312
– – – 1,378 5,986 – 14,003 2,259 – 23,626
Accumulateddepreciation – – – – 2,084 – 5,550 1,739 – 9,373
Netcapitalizedcosts – – – 1,378 3,902 – 8,453 520 – 14,253
Costsincurredfortheyearended31Decemberb
Acquisitionofpropertiesc
Proved – – – – – – – – – –
Unproved – – – – 31 – 10 – – 41
– – – – 31 – 10 – – 41
Explorationandappraisalcostsd – – – – 21 – 77 3 – 101
Development – – – 30 538 – 1,182 246 – 1,996
Totalcosts – – – 30 590 – 1,269 249 – 2,138
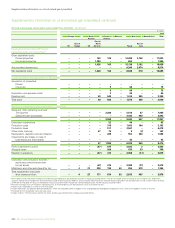
Resultsofoperationsfortheyearended31December
Salesandotheroperatingrevenuese
Thirdparties – – – – 1,977 – 4,919 351 – 7,247
Salesbetweenbusinesses – – – – – – 2,838 – – 2,838
– – – – 1,977 – 7,757 351 – 10,085
Explorationexpenditure – – – – 23 – 37 – – 60
Productioncosts – – – – 354 – 1,428 159 – 1,941
Productiontaxes – – – – 702 – 2,597 – – 3,299
Othercosts(income) – – – – (69) – 12 (2) – (59)
Depreciation,depletionandamortization – – – – 281 – 1,073 274 – 1,628
Impairmentsandlosseson
saleofbusinessesandxedassets – – – – – – 72 – – 72
– – – – 1,291 – 5,219 431 – 6,941
Prot(loss)beforetaxation – – – – 686 – 2,538 (80) – 3,144
Allocabletaxes – – – – 270 – 501 – – 771
Resultsofoperations – – – – 416 – 2,037 (80) – 2,373
Explorationandproductionactivities–
equity-accountedentitiesafter
tax(asabove) – – – – 416 – 2,037 (80) – 2,373
Midstreamandotheractivitiesaftertaxf – 5 29 134 214 56 (113) 611 – 936
Totalreplacementcostprot
afterinterestandtax – 5 29 134 630 56 1,924 531 – 3,309
aT
hesetablescontaininformationrelatingtooilandnaturalgasexplorationandproductionactivitiesofequity-accountedentities.Midstreamactivitiesrelatingtothemanagementandownershipofcrude
oilandnaturalgaspipelines,processingandexportterminalsandLNGprocessingfacilitiesandtransportationaswellasdownstreamactivitiesofTNK-BPareexcluded.Theamountsreportedforequity-
accountedentitiesexcludethecorrespondingamountsfortheirequity-accountedentities.
b
Decommissioningassetsareincludedincapitalizedcostsat31Decemberbutareexcludedfromcostsincurredfortheyear.
c
Includescostscapitalizedasaresultofassetexchanges.
d
Includesexplorationandappraisaldrillingexpenditures,whicharecapitalizedwithinintangibleassets,andgeologicalandgeophysicalexplorationcosts,whicharechargedtoincomeasincurred.
e
Presentednetoftransportationcosts,purchasesandsalestaxes.
f
Includesinterest,minorityinterestandthenetresultsofequity-accountedentitiesofequity-accountedentities.
232BPAnnualReportandForm20-F2010