BP 2010 Annual Report Download - page 18
Download and view the complete annual report
Please find page 18 of the 2010 BP annual report below. You can navigate through the pages in the report by either clicking on the pages listed below, or by using the keyword search tool below to find specific information within the annual report.-
 1
1 -
2
-
3
-
4
-
5
-
6
-
7
-
 8
8 -
 9
9 -
 10
10 -
 11
11 -
 12
12 -
 13
13 -
 14
14 -
 15
15 -
 16
16 -
 17
17 -
 18
18 -
 19
19 -
 20
20 -
 21
21 -
 22
22 -
 23
23 -
 24
24 -
 25
25 -
 26
26 -
 27
27 -
 28
28 -
29
-
30
-
31
-
32
-
33
-
34
-
35
-
36
-
37
-
38
-
39
-
40
-
41
-
42
-
43
-
44
-
45
-
46
-
47
-
48
-
49
-
50
-
51
-
52
-
53
-
54
-
55
-
56
-
57
-
58
-
59
-
60
-
61
-
62
-
63
-
64
-
65
-
66
-
67
-
68
-
69
-
70
-
71
-
72
-
73
-
74
-
75
-
76
-
77
-
78
-
79
-
80
-
81
-
82
-
83
-
84
-
85
-
86
-
87
-
88
-
89
-
90
-
91
-
92
-
93
-
94
-
95
-
96
-
97
-
98
-
99
-
100
-
101
-
102
-
103
-
104
-
105
-
106
-
107
-
108
-
109
-
110
-
111
-
112
-
113
-
114
-
115
-
116
-
117
-
118
-
119
-
120
-
121
-
122
-
123
-
124
-
125
-
126
-
127
-
128
-
129
-
130
-
131
-
132
-
133
-
134
-
135
-
136
-
137
-
138
-
139
-
140
-
141
-
142
-
143
-
144
-
145
-
146
-
147
-
148
-
149
-
150
-
151
-
152
-
153
-
154
-
155
-
156
-
157
-
158
-
159
-
160
-
161
-
162
-
163
-
164
-
165
-
166
-
167
-
168
-
169
-
170
-
171
-
172
-
173
-
174
-
175
-
176
-
177
-
178
-
179
-
180
-
181
-
182
-
183
-
184
-
185
-
186
-
187
-
188
-
189
-
190
-
191
-
192
-
193
-
194
-
195
-
196
-
197
-
198
-
199
-
200
-
201
-
202
-
203
-
204
-
205
-
206
-
207
-
208
-
209
-
210
-
211
-
212
-
213
-
214
-
215
-
216
-
217
-
218
-
219
-
220
-
221
-
222
-
223
-
224
-
225
-
226
-
227
-
228
-
229
-
230
-
231
-
232
-
233
-
234
-
235
-
236
-
237
-
238
-
239
-
240
-
241
-
242
-
243
-
244
-
245
-
246
-
247
-
248
-
249
-
250
-
251
-
252
-
253
-
254
-
255
-
256
-
257
-
258
-
259
-
260
-
261
-
262
-
263
-
264
-
265
-
266
-
267
-
268
-
269
-
270
-
271
-
272
 |
 |

Businessreview
Ourmarket
Energymarketsin2010continuedtorecoverfrom
theimpactoftheglobaleconomicrecession.
Lookingahead,thelong-termoutlookisoneof
growingdemandforenergya,particularlyinAsia,
andofchallengesfortheindustryinmeetingthis
demand.Risingincomesandexpandingurban
populationsareexpectedtodrivedemand,while
theevolutiontowardsalower-carboneconomywill
requiretechnology,innovationandinvestment.
Worldoilconsumptionreboundedin2010,withcontinuedrobustgrowthin
Chinaandothernon-OECDcountriesandtherstincreaseamongOECD
countriessince2005.Averagecrudeoilpricesin2010werehigherthanin
thepreviousyear.Averagenaturalgaspricesalsoincreasedin2010.
Reningmarginsstabilizedasoilproductdemandrecovered.
Economic context
Theworldeconomycontinuedtorecoverin2010.Weexpectslowerglobal
growthin2011,ledbyemergingeconomies,withdevelopedcountries
laggingbehindbecauseoftheneedtodealwiththeirinternalimbalances.
Energydemand,andinparticularoildemand,followsthisoveralleconomic
pattern,recoveringstronglyin2010butfacingmorechallengingconditions
aswemoveinto2011,especiallyinOECDmarkets.
Concernsaboutthevolatilityofcommodityandnancialmarkets,
combinedwithrenewedfocusonclimatechangeandtheearlyexperiences
witheffortstoreduceCO2emissionsintheEUandelsewhere,haveledto
anincreasedfocusontheappropriateroleformarkets,government
oversightandotherpolicymeasuresrelatingtothesupplyand
consumptionofenergy.Weexpectregulationandtaxationoftheenergy
industryandenergyuserstoincreaseinmanyareasovertheshortto
mediumterm.
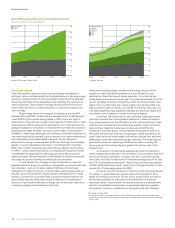
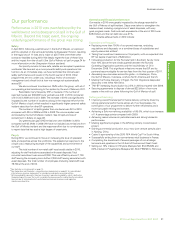
DatedBrentoilprice 150
HenryHubgasprice(FirstofMonthIndex)
Globalindicatorrefiningmargin(GIM)b
120
90
60
30
2004 2005 2006 2007 2008 2009 2010
Source:Platts/BP.
Crude oil and gas prices, and refining margins
($perbarrelofoilequivalent)
Crude oil prices
DatedBrentfortheyearaveraged$79.50perbarrel,about29%above
2009’saverageof$61.67perbarrel.Pricestradedinarelativelynarrow
bandof$70-80perbarrelformostoftheyearbeforerisinginthefourth
quarter.Pricesexceeded$90perbarrelinDecember,thehighestlevel
sinceOctober2008.
Globaloilconsumptionreboundedsharply,reectingarecoveryin
theglobaleconomyandseveralone-timefactors,risingbyroughly
2.8millionb/dfortheyear(3.3%)c,thelargestannualincreasesince2004.
Growthwasbroadly-based,withthelargest(volumetric)increasesseenin
ChinaandtheUS.Therelativestabilityincrudeoilpricesformuchofthe
yearreectedthestabilityofOPECcrudeoilsupply,asOPECmembers
sustainedtheproductioncutsimplementedinlate2008throughout2010,
withcrudeproductionaveragingroughly2millionb/dbelowthe2008level.
CommercialoilinventoriesintheOECDremainedhighformuchoftheyear
beforefallingastheglobalsupply-balancebegantotighten–andprices
begantorise–laterintheyear.
Thereboundinoilpricesin2010followedadeclinein2009–the
rstsince2001.Globaloilconsumptionin2009reectedtheeconomic
slowdown,fallingbyroughly1.2millionb/dfortheyear(1.7%)d,thelargest
annualdeclinesince1982.Thebiggestreductionswereearlyintheyear,
withOECDcountriesaccountingfortheentireglobaldecline.Crudeoil
pricesrosesharplyinthesecondquarterinresponsetosustainedOPEC
productioncutsandemergingsignsofstabilizationintheworldeconomy,
despiteveryhighcommercialoilinventoriesintheOECD.OPECmembers
cutcrudeoilproductionbyroughly2.5millionb/dein2009.
Weexpectoilpricemovementsin2011tocontinuetobedrivenby
thepaceofglobaleconomicgrowthanditsresultingimplicationsforoil
consumption,andbyOPECproductiondecisions.
a
BP Energy Outlook 2030.
b
Seefootnoteeonpage56.
c
Oil Market Report 10 February 2011©OECD/IEA2011,page4,rstparagraph.
d
BP Statistical Review of World Energy June 2010.
e Oil Market Report 10 February 2011©OECD/IEA2011,Table1,page59.
16BPAnnualReportandForm20-F2010